ICICI Bank 2009 Annual Report Download - page 151
Download and view the complete annual report
Please find page 151 of the 2009 ICICI Bank annual report below. You can navigate through the pages in the report by either clicking on the pages listed below, or by using the keyword search tool below to find specific information within the annual report.-
 1
1 -
2
-
3
-
4
-
5
-
6
-
7
-
8
-
9
-
10
-
11
-
12
-
13
-
14
-
15
-
16
-
17
-
18
-
19
-
20
-
21
-
22
-
23
-
24
-
25
-
26
-
27
-
28
-
29
-
30
-
31
-
32
-
33
-
34
-
35
-
36
-
37
-
38
-
39
-
40
-
41
-
42
-
43
-
44
-
45
-
46
-
47
-
48
-
49
-
50
-
51
-
52
-
53
-
54
-
55
-
56
-
57
-
58
-
59
-
60
-
61
-
62
-
63
-
64
-
65
-
66
-
67
-
68
-
69
-
70
-
71
-
72
-
73
-
74
-
75
-
76
-
77
-
78
-
79
-
80
-
81
-
82
-
83
-
84
-
85
-
86
-
87
-
88
-
89
-
90
-
91
-
92
-
93
-
94
-
95
-
96
-
97
-
98
-
99
-
100
-
101
-
102
-
103
-
104
-
105
-
106
-
107
-
108
-
109
-
110
-
111
-
112
-
113
-
114
-
115
-
116
-
117
-
118
-
119
-
120
-
121
-
122
-
123
-
124
-
125
-
126
-
127
-
128
-
129
-
130
-
131
-
132
-
133
-
134
-
135
-
136
-
137
-
138
-
139
-
140
-
 141
141 -
 142
142 -
 143
143 -
 144
144 -
 145
145 -
 146
146 -
 147
147 -
 148
148 -
 149
149 -
 150
150 -
 151
151 -
 152
152 -
 153
153 -
 154
154 -
 155
155 -
 156
156 -
 157
157 -
 158
158 -
 159
159 -
 160
160 -
 161
161 -
162
-
163
-
164
-
165
-
166
-
167
-
168
-
169
-
170
-
171
-
172
-
173
-
174
-
175
-
176
-
177
-
178
-
179
-
180
 |
 |

F77
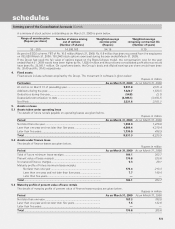
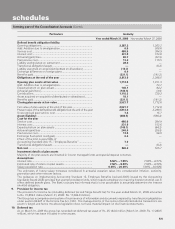
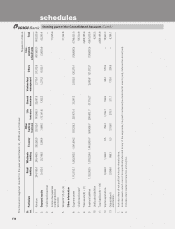
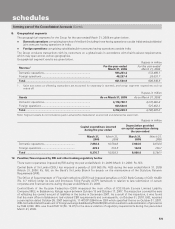
The business segment results for the year ended March 31, 2009 on this basis are given below. Rupees in million
Sr.
no. Particulars Retail
banking Wholesale
banking Treasury Other
banking
business
Life
insurance General
insurance Venture fund
management Others Inter-
segment
adjustments Total
1 Revenue 230,152.1 248,077.1 297,421.3 45,280.9 165,074.3 26,624.0 3,456.5 32,160.0 (406,715.4) 641,530.8
2Segment results 580.5 34,133.1 13,069.4 6,079.1 (8,595.6) 2.7 2,020.8 5,893.5 (3,500.0) 49,683.5
3 Unallocated expenses —
4 Income tax expenses
(net)/(net deferred
tax credit)
15,889.3
5 Net profit1 (2)- (3) - (4) 33,794.2
Other information
6 Segment assets 958,656.7 1,357,062.5 1,397,053.4 660,402.9 336,670.8 53,464.4 2,706.2 178,395.0 (191,380.4) 4,753,031.5
7 Unallocated assets273,878.2
8 Total assets (6) + (7) 4,826,909.7
9 Segment liabilities 1,117,555.2 1,111,564.6 1,526,005.73657,432.03339,864.4354,455.132,734.73180,537.03(191,380.4) 4,798,768.3
10 Unallocated liabilities 28,141.4
11 Total liabilities (9) + (10) 4,826,909.7
12 Capital expenditure 4,224.2 1,264.2 3.3 514.0 854.5 692.3 114.0 715.0 (10.8) 8,370.7
13 Depreciation &
amortisation 3,628.6 1,027.3 4.7 2,259.6 554.1 264.4 13.2 314.9 — 8,066.8
1. Includes share of net profit of minority shareholders.
2. Includes assets which cannot be specifically allocated to any of the segments, tax paid in advance/tax deducted at source (net), deferred tax asset (net).
3. Includes share capital and reserves and surplus.
forming part of the Consolidated Accounts (Contd.)
schedules