ICICI Bank 2009 Annual Report Download - page 115
Download and view the complete annual report
Please find page 115 of the 2009 ICICI Bank annual report below. You can navigate through the pages in the report by either clicking on the pages listed below, or by using the keyword search tool below to find specific information within the annual report.-
 1
1 -
2
-
3
-
4
-
5
-
6
-
7
-
8
-
9
-
10
-
11
-
12
-
13
-
14
-
15
-
16
-
17
-
18
-
19
-
20
-
21
-
22
-
23
-
24
-
25
-
26
-
27
-
28
-
29
-
30
-
31
-
32
-
33
-
34
-
35
-
36
-
37
-
38
-
39
-
40
-
41
-
42
-
43
-
44
-
45
-
46
-
47
-
48
-
49
-
50
-
51
-
52
-
53
-
54
-
55
-
56
-
57
-
58
-
59
-
60
-
61
-
62
-
63
-
64
-
65
-
66
-
67
-
68
-
69
-
70
-
71
-
72
-
73
-
74
-
75
-
76
-
77
-
78
-
79
-
80
-
81
-
82
-
83
-
84
-
85
-
86
-
87
-
88
-
89
-
90
-
91
-
92
-
93
-
94
-
95
-
96
-
97
-
98
-
99
-
100
-
101
-
102
-
103
-
104
-
 105
105 -
 106
106 -
 107
107 -
 108
108 -
 109
109 -
 110
110 -
 111
111 -
 112
112 -
 113
113 -
 114
114 -
 115
115 -
 116
116 -
 117
117 -
 118
118 -
 119
119 -
 120
120 -
 121
121 -
 122
122 -
 123
123 -
 124
124 -
 125
125 -
126
-
127
-
128
-
129
-
130
-
131
-
132
-
133
-
134
-
135
-
136
-
137
-
138
-
139
-
140
-
141
-
142
-
143
-
144
-
145
-
146
-
147
-
148
-
149
-
150
-
151
-
152
-
153
-
154
-
155
-
156
-
157
-
158
-
159
-
160
-
161
-
162
-
163
-
164
-
165
-
166
-
167
-
168
-
169
-
170
-
171
-
172
-
173
-
174
-
175
-
176
-
177
-
178
-
179
-
180
 |
 |

F41
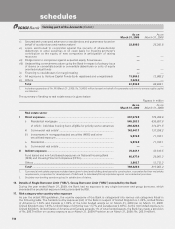
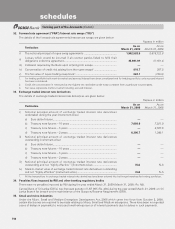
Rupees in million
As on March 31, 2008
Sr.
No. Particulars Currency
derivatives1Interest rate
derivatives2
1. Derivatives (Notional principal amount)
a) For hedging ........................................................................................... 27,056.3 206,265.5
b) For trading ............................................................................................. 1,536,757.0 6,372,250.2
2. Marked to market positions3
a) Asset (+) ............................................................................................... 30,085.1 184.5
b) Liability (–) ............................................................................................. — —
3. Credit exposure4 ............................................................................................ 109,607.8 83,103.4
4. Likely impact of one percentage change in interest rate (100*PV01)5
a) On hedging derivatives6 ........................................................................ 559.5 8,879.2
b) On trading derivatives ........................................................................... 1,777 .8 2,270.7
5. Maximum and minimum of 100*PV01 observed during the year
a) On hedging6
Maximum .............................................................................................. (11.6) (4,268.4)
Minimum ............................................................................................... (714.7) (9,467.8)
b) On trading
Maximum .............................................................................................. (313.2) 2,809.2
Minimum ............................................................................................... (1,870.9) 464.9
1. Options and cross currency interest rate swaps are included in currency derivatives.
2. Foreign currency interest rate swaps, forward rate agreements and swaptions are included in interest rate derivatives.
3. For trading portfolio including accrued interest. Represents net positions.
4. Includes accrued interest.
5. Amounts given are absolute values on a net basis, excluding options.
6. The swap contracts entered for hedging purpose would have an opposite and offsetting impact with the underlying on-balance sheet
items.
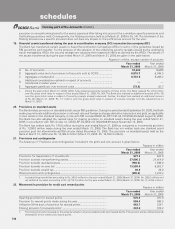
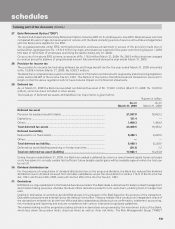
The Bank deals in credit derivative instruments including credit default swaps, credit linked notes, collateralised debt
obligations and principal protected structures. The notional principal amount of these credit derivatives outstanding as on
March 31, 2009 was Rs. 18,411.4 million (March 31, 2008: Rs. 12,231.2 million) in funded instruments and Rs. 38,712.6
million (March 31, 2008: Rs. 50,568.5 million) in non-funded instruments which includes Rs. 253.6 million (March 31, 2008:
Rs. 200.6 million) of protection bought by the Bank.
The profit and loss impact of the above portfolio on account of mark-to-market and realised loss during the year ended
March 31, 2009 was a net loss of Rs. 2,754.3 million (March 31, 2008: Rs. 6,848.3 million). As on March 31, 2009, the total
outstanding mark-to-market position of the above portfolio was a net loss of Rs. 4,843.9 million (March 31, 2008: Rs. 5,870.6
million). The credit derivatives are marked to market by the Bank based on counter-party valuation quotes, or internal models
using inputs from market sources such as Bloomberg/Reuters, counter-parties and FIMMDA.
The Bank offers deposits to customers of its offshore branches with structured returns linked to interest, forex or equity
benchmarks. The Bank covers these exposures in the inter-bank market. As on March 31, 2009, the net open position
on this portfolio was Rs. Nil (March 31, 2008: Rs. 4.0 million) with mark-to-market loss of Rs. Nil (March 31, 2008:
Rs. 0.1 million).
The notional principal amount of forex contracts, classified as non-trading at March 31, 2009 amounted to Rs. 205,635.1
million (March 31, 2008: Rs. 393,701.5 million). The notional principal amount of forex contracts classified as trading at
March 31, 2009 amounted to Rs. 2,378,035.8 million (March 31, 2008: Rs. 2,678,010.8 million).
The net overnight open position at March 31, 2009 was Rs. 512.3 million (March 31, 2008: Rs. 2,584.5 million).
forming part of the Accounts (Contd.)
schedules