ICICI Bank 2009 Annual Report Download - page 49
Download and view the complete annual report
Please find page 49 of the 2009 ICICI Bank annual report below. You can navigate through the pages in the report by either clicking on the pages listed below, or by using the keyword search tool below to find specific information within the annual report.-
 1
1 -
2
-
3
-
4
-
5
-
6
-
7
-
8
-
9
-
10
-
11
-
12
-
13
-
14
-
15
-
16
-
17
-
18
-
19
-
20
-
21
-
22
-
23
-
24
-
25
-
26
-
27
-
28
-
29
-
30
-
31
-
32
-
33
-
34
-
35
-
36
-
37
-
38
-
 39
39 -
 40
40 -
 41
41 -
 42
42 -
 43
43 -
 44
44 -
 45
45 -
 46
46 -
 47
47 -
 48
48 -
 49
49 -
 50
50 -
 51
51 -
 52
52 -
 53
53 -
 54
54 -
 55
55 -
 56
56 -
 57
57 -
 58
58 -
 59
59 -
60
-
61
-
62
-
63
-
64
-
65
-
66
-
67
-
68
-
69
-
70
-
71
-
72
-
73
-
74
-
75
-
76
-
77
-
78
-
79
-
80
-
81
-
82
-
83
-
84
-
85
-
86
-
87
-
88
-
89
-
90
-
91
-
92
-
93
-
94
-
95
-
96
-
97
-
98
-
99
-
100
-
101
-
102
-
103
-
104
-
105
-
106
-
107
-
108
-
109
-
110
-
111
-
112
-
113
-
114
-
115
-
116
-
117
-
118
-
119
-
120
-
121
-
122
-
123
-
124
-
125
-
126
-
127
-
128
-
129
-
130
-
131
-
132
-
133
-
134
-
135
-
136
-
137
-
138
-
139
-
140
-
141
-
142
-
143
-
144
-
145
-
146
-
147
-
148
-
149
-
150
-
151
-
152
-
153
-
154
-
155
-
156
-
157
-
158
-
159
-
160
-
161
-
162
-
163
-
164
-
165
-
166
-
167
-
168
-
169
-
170
-
171
-
172
-
173
-
174
-
175
-
176
-
177
-
178
-
179
-
180
 |
 |

47Annual Report 2008-2009
The Power of Belief
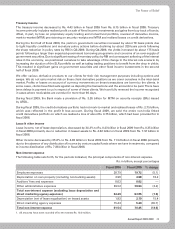
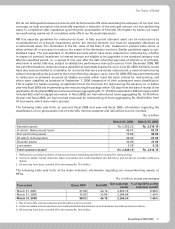
Key ratios
The following table sets forth, for the periods indicated, the key financial ratios.
Fiscal 2008 Fiscal 2009
Return on average equity (%)1 11.1 7.7
Return on average assets (%)2 1.1 1.0
Earnings per share (Rs.) 39.4 33.8
Book value per share (Rs.) 417.5 444.9
Fee to income (%) 41.6 41.4
Cost to income (%)3 50.0 43.4
1. Return on average equity is the ratio of the net profit after tax to the quarterly average equity and reserves.
2. Return on average assets is the ratio of net profit after tax to average assets.
3. Cost represents operating expense including DMA cost which is expensed upfront but excluding lease depreciation. Income
represents net interest income and non-interest income and is net of lease depreciation.
Net interest income and spread analysis
The following table sets forth, for the periods indicated the net interest income and spread analysis.
Rs. in billion, except percentages
Fiscal 2008 Fiscal 2009 % change
Average interest-earning assets13,288.34 3,436.20 4.5
Average interest-bearing liabilities1 3,119.28 3,249.16 4.2
Net interest margin 2.2% 2.4% —
Average yield 9.4% 9.1% —
Average cost of funds 7.5% 7.0% —
Interest spread 1.8% 2.1% —
1. Averages are based on daily balances.
2. All amounts have been rounded off to the nearest Rs. 10.0 million.
Net interest income
Net interest income increased by 14.6% to Rs. 83.67 billion in fiscal 2009 from Rs. 73.04 billion in fiscal 2008,
reflecting primarily the following:
an increase of Rs. 147.86 billion or 4.5% in average interest-earning assets; and
an increase in net interest margin by 21 basis points to 2.4% in fiscal 2009 compared to 2.2% in fiscal 2008.
Interest income increased by 1.0% to Rs. 310.93 billion in fiscal 2009 from Rs. 307.88 billion in fiscal 2008 primarily
due to increase in average interest-earning assets by Rs. 147.86 billion, offset, in part, by a decrease of 31 basis
points in yield on average interest-earning assets.
Average interest-earning assets increased marginally in rupee terms by Rs. 147.86 billion or 4.5% to Rs. 3,436.20
billion in fiscal 2009 from Rs. 3,288.34 billion in fiscal 2008. This increase is after considering the impact of rupee
depreciation on foreign currency denominated assets.
Increase in average interest-earning assets is primarily on account of increase in average advances by Rs. 155.09
billion. This increase in average advances is primarily on account of increase in non-retail advances, offset, in
part, by decrease in retail advances. While net advances of overseas branches (including offshore banking unit)
decreased by US$ 1.2 billion or 10.1% to US$ 10.7 billion at year-end fiscal 2009 from US$ 11.9 billion at year-
end fiscal 2008, the net advances of overseas branches, in rupee terms, increased due to the impact of rupee
depreciation during fiscal 2009. Net retail advances (including dealer financing and developer financing portfolio
of Rs. 8.75 billion and Rs. 24.08 billion, respectively) were Rs. 1,062.03 billion at year-end fiscal 2009 compared to
Rs. 1,316.63 billion at year-end fiscal 2008. Average interest-earning investments in fiscal 2009 remained at about