ICICI Bank 2009 Annual Report Download - page 52
Download and view the complete annual report
Please find page 52 of the 2009 ICICI Bank annual report below. You can navigate through the pages in the report by either clicking on the pages listed below, or by using the keyword search tool below to find specific information within the annual report.-
 1
1 -
2
-
3
-
4
-
5
-
6
-
7
-
8
-
9
-
10
-
11
-
12
-
13
-
14
-
15
-
16
-
17
-
18
-
19
-
20
-
21
-
22
-
23
-
24
-
25
-
26
-
27
-
28
-
29
-
30
-
31
-
32
-
33
-
34
-
35
-
36
-
37
-
38
-
39
-
40
-
41
-
 42
42 -
 43
43 -
 44
44 -
 45
45 -
 46
46 -
 47
47 -
 48
48 -
 49
49 -
 50
50 -
 51
51 -
 52
52 -
 53
53 -
 54
54 -
 55
55 -
 56
56 -
 57
57 -
 58
58 -
 59
59 -
 60
60 -
 61
61 -
 62
62 -
63
-
64
-
65
-
66
-
67
-
68
-
69
-
70
-
71
-
72
-
73
-
74
-
75
-
76
-
77
-
78
-
79
-
80
-
81
-
82
-
83
-
84
-
85
-
86
-
87
-
88
-
89
-
90
-
91
-
92
-
93
-
94
-
95
-
96
-
97
-
98
-
99
-
100
-
101
-
102
-
103
-
104
-
105
-
106
-
107
-
108
-
109
-
110
-
111
-
112
-
113
-
114
-
115
-
116
-
117
-
118
-
119
-
120
-
121
-
122
-
123
-
124
-
125
-
126
-
127
-
128
-
129
-
130
-
131
-
132
-
133
-
134
-
135
-
136
-
137
-
138
-
139
-
140
-
141
-
142
-
143
-
144
-
145
-
146
-
147
-
148
-
149
-
150
-
151
-
152
-
153
-
154
-
155
-
156
-
157
-
158
-
159
-
160
-
161
-
162
-
163
-
164
-
165
-
166
-
167
-
168
-
169
-
170
-
171
-
172
-
173
-
174
-
175
-
176
-
177
-
178
-
179
-
180
 |
 |

50
Management’s Discussion and Analysis
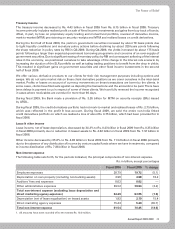
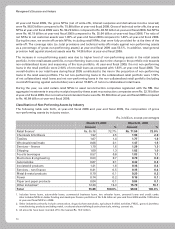
Total non-interest expense decreased by 13.6% to Rs. 70.45 billion in fiscal 2009 from Rs. 81.54 billion in fiscal
2008 primarily due to a 65.7% decrease in direct marketing agency expenses and a 2.2% decrease in other
administrative expenses.
We use marketing agents, called direct marketing agents or associates, for sourcing our retail assets. We include
commissions paid to these direct marketing agents of our retail assets in non-interest expense. These commissions
are expensed upfront and not amortised over the life of the loan. Due to lower retail disbursements, lower issuance
of new credit cards and reduction in rate of commission, direct marketing agency expenses decreased by 65.7%
to Rs. 5.29 billion in fiscal 2009 compared to Rs. 15.43 billion in fiscal 2008.
Other administrative expenses decreased by 2.2% to Rs. 38.64 billion in fiscal 2009 from Rs. 39.52 billion in fiscal
2008 primarily due to overall cost reduction initiatives undertaken by us, offsetting the increase in expenses related
to retail business (primarily related to collections) and increase in our branch and ATM network. The number of
our branches and extension counters in India increased to 1,419 at year-end fiscal 2009 from 1,262 at year-end
fiscal 2008. The number of ATMs increased to 4,713 at year-end fiscal 2009 from 3,881 at year-end fiscal 2008.
There was a reduction in expenses on account of printing and stationary, advertisement and publicity and postage,
telegrams and telephone expenses in fiscal 2009 as compared to fiscal 2008.
Employee expenses decreased by 5.1% to Rs. 19.72 billion in fiscal 2009 from Rs. 20.79 billion in fiscal 2008
primarily due to a 15.0% decrease in the employee base to 34,596 at year-end fiscal 2009 from 40,686 at year-end
fiscal 2008, offset, in part, by annual increase in salaries.
Depreciation on own property increased by 18.2% to Rs. 4.68 billion in fiscal 2009 from Rs. 3.96 billion in fiscal
2008, reflecting the addition of new branches. Depreciation on leased assets was Rs. 2.10 billion in fiscal 2009 as
compared to Rs. 1.82 billion in fiscal 2008.
Provisions and tax
Provisions and contingencies (excluding provision for tax) increased to Rs. 38.08 billion in fiscal 2009 from
Rs. 29.05 billion in fiscal 2008 primarily due to higher level of specific provisioning on non-performing loans,
offset, in part, by lower general provisioning as the advances portfolio did not increase. Specific provisioning
on non-performing assets increased in fiscal 2009 compared to fiscal 2008 primarily due to increase in retail
non-performing loans. The increase in retail non-performing loans primarily reflects the seasoning of the secured loan
portfolio and relatively higher losses on unsecured portfolio and the adverse macro-economic environment.
The Ministry of Finance, Government of India has issued guidelines for the implementation of the Agriculture debt
waiver and relief scheme for farmers on May 23, 2008 which have been duly implemented by us.
There was a reduction in general provision requirement in certain categories of standard advances as per RBI
guidelines issued on November 15, 2008 as a counter-cyclical measure. While the cumulative provision requirement
as per the revised rates of general provision requirement was Rs. 8.38 billion at year-end fiscal 2009, we continue
to hold a cumulative general provision of Rs. 14.36 billion at in accordance with RBI guidelines, which does not
allow reversal of excess cumulative general provision held as of September 30, 2008. General provision on
standard assets made in fiscal 2008 was Rs. 1.59 billion.
Income tax expense (including wealth tax) increased by 51.3% to Rs. 13.59 billion in fiscal 2009 from Rs. 8.98
billion in fiscal 2008. The effective tax rate of 26.56% in fiscal 2009 was higher compared to the effective tax
rate of 17.77% in fiscal 2008 primarily due to change in mix of taxable profits, which had a lower component of
income from dividend and capital gains.