ICICI Bank 2009 Annual Report Download - page 83
Download and view the complete annual report
Please find page 83 of the 2009 ICICI Bank annual report below. You can navigate through the pages in the report by either clicking on the pages listed below, or by using the keyword search tool below to find specific information within the annual report.-
 1
1 -
2
-
3
-
4
-
5
-
6
-
7
-
8
-
9
-
10
-
11
-
12
-
13
-
14
-
15
-
16
-
17
-
18
-
19
-
20
-
21
-
22
-
23
-
24
-
25
-
26
-
27
-
28
-
29
-
30
-
31
-
32
-
33
-
34
-
35
-
36
-
37
-
38
-
39
-
40
-
41
-
42
-
43
-
44
-
45
-
46
-
47
-
48
-
49
-
50
-
51
-
52
-
53
-
54
-
55
-
56
-
57
-
58
-
59
-
60
-
61
-
62
-
63
-
64
-
65
-
66
-
67
-
68
-
69
-
70
-
71
-
72
-
 73
73 -
 74
74 -
 75
75 -
 76
76 -
 77
77 -
 78
78 -
 79
79 -
 80
80 -
 81
81 -
 82
82 -
 83
83 -
 84
84 -
 85
85 -
 86
86 -
 87
87 -
 88
88 -
 89
89 -
 90
90 -
 91
91 -
 92
92 -
 93
93 -
94
-
95
-
96
-
97
-
98
-
99
-
100
-
101
-
102
-
103
-
104
-
105
-
106
-
107
-
108
-
109
-
110
-
111
-
112
-
113
-
114
-
115
-
116
-
117
-
118
-
119
-
120
-
121
-
122
-
123
-
124
-
125
-
126
-
127
-
128
-
129
-
130
-
131
-
132
-
133
-
134
-
135
-
136
-
137
-
138
-
139
-
140
-
141
-
142
-
143
-
144
-
145
-
146
-
147
-
148
-
149
-
150
-
151
-
152
-
153
-
154
-
155
-
156
-
157
-
158
-
159
-
160
-
161
-
162
-
163
-
164
-
165
-
166
-
167
-
168
-
169
-
170
-
171
-
172
-
173
-
174
-
175
-
176
-
177
-
178
-
179
-
180
 |
 |

F9
schedules
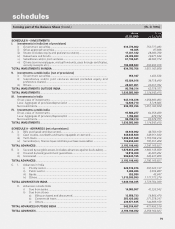
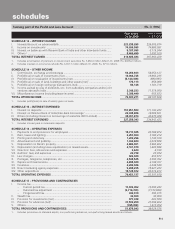
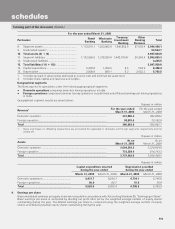
forming part of the Balance Sheet (Contd.) (Rs. in ‘000s)
As on
31.03.2009 As on
31.03.2008
SCHEDULE 8 – INVESTMENTS
I. Investments in India [net of provisions]
i) Government securities ............................................................................. 633,774,902 753,777,483
ii) Other approved securities........................................................................ 93,405 97,946
iii) Shares (includes equity and preference shares) ...................................... 17,031,332 29,200,790
iv) Debentures and bonds ............................................................................ 26,000,683 18,871,649
v) Subsidiaries and/or joint ventures ............................................................ 61,194,621 46,382,774
vi) Others (commercial paper, mutual fund units, pass through certificates,
security receipts etc.) ............................................................................... 196,688,823 202,833,016
TOTAL INVESTMENTS IN INDIA ........................................................................... 934,783,766 1,051,163,658
II. Investments outside India [net of provisions]
i) Government securities ............................................................................. 953,347 1,402,546
ii) Subsidiaries and/or joint ventures abroad (includes equity and
preference shares) ................................................................................... 65,924,016 38,719,449
iii) Others ....................................................................................................... 28,921,951 23,257,762
TOTAL INVESTMENTS OUTSIDE INDIA ............................................................... 95,799,314 63,379,757
TOTAL INVESTMENTS ........................................................................................... 1,030,583,080 1,114,543,415
III. Investments in India
Gross value of investments ............................................................................. 947,314,476 1,056,883,463
Less: Aggregate of provision/depreciation ..................................................... 12,530,710 5,719,805
Net investments ............................................................................................... 934,783,766 1,051,163,658
IV. Investments outside India
Gross value of investments ............................................................................. 97,586,277 64,358,489
Less: Aggregate of provision/depreciation ..................................................... 1,786,963 978,732
Net investments ............................................................................................... 95,799,314 63,379,757
TOTAL INVESTMENTS ........................................................................................... 1,030,583,080 1,114,543,415
SCHEDULE 9 - ADVANCES [net of provisions]
A. i) Bills purchased and discounted ............................................................... 40,610,992 46,763,159
ii) Cash credits, overdrafts and loans repayable on demand ...................... 343,945,509 348,051,840
iii) Term loans................................................................................................ 1,696,347,568 1,755,794,419
iv) Securitisation, finance lease and hire purchase receivables .................. 102,204,423 105,551,409
TOTAL ADVANCES ................................................................................................. 2,183,108,492 2,256,160,827
B. i) Secured by tangible assets (includes advances against book debts) ..... 1,575,653,288 1,693,135,659
ii) Covered by bank/government guarantees ............................................... 14,815,009 42,087,202
iii) Unsecured ................................................................................................ 592,640,195 520,937,966
TOTAL ADVANCES ................................................................................................. 2,183,108,492 2,256,160,827
C. I. Advances in India
i) Priority sector ................................................................................... 620,515,976 597,325,197
ii) Public sector ..................................................................................... 3,494,486 3,559,887
iii) Banks ................................................................................................ 252,580 45,947
iv) Others ............................................................................................... 1,015,930,993 1,177,773,278
TOTAL ADVANCES IN INDIA ................................................................................. 1,640,194,035 1,778,704,309
II. Advances outside India
i) Due from banks ................................................................................ 14,965,907 41,225,542
ii) Due from others
a) Bills purchased and discounted ............................................... 13,856,733 19,965,470
b) Commercial loans..................................................................... 283,420,282 271,379,347
c) Others ....................................................................................... 230,671,535 144,886,159
TOTAL ADVANCES OUTSIDE INDIA ..................................................................... 542,914,457 477,456,518
TOTAL ADVANCES ................................................................................................. 2,183,108,492 2,256,160,827