ICICI Bank 2009 Annual Report Download - page 47
Download and view the complete annual report
Please find page 47 of the 2009 ICICI Bank annual report below. You can navigate through the pages in the report by either clicking on the pages listed below, or by using the keyword search tool below to find specific information within the annual report.-
 1
1 -
2
-
3
-
4
-
5
-
6
-
7
-
8
-
9
-
10
-
11
-
12
-
13
-
14
-
15
-
16
-
17
-
18
-
19
-
20
-
21
-
22
-
23
-
24
-
25
-
26
-
27
-
28
-
29
-
30
-
31
-
32
-
33
-
34
-
35
-
36
-
 37
37 -
 38
38 -
 39
39 -
 40
40 -
 41
41 -
 42
42 -
 43
43 -
 44
44 -
 45
45 -
 46
46 -
 47
47 -
 48
48 -
 49
49 -
 50
50 -
 51
51 -
 52
52 -
 53
53 -
 54
54 -
 55
55 -
 56
56 -
 57
57 -
58
-
59
-
60
-
61
-
62
-
63
-
64
-
65
-
66
-
67
-
68
-
69
-
70
-
71
-
72
-
73
-
74
-
75
-
76
-
77
-
78
-
79
-
80
-
81
-
82
-
83
-
84
-
85
-
86
-
87
-
88
-
89
-
90
-
91
-
92
-
93
-
94
-
95
-
96
-
97
-
98
-
99
-
100
-
101
-
102
-
103
-
104
-
105
-
106
-
107
-
108
-
109
-
110
-
111
-
112
-
113
-
114
-
115
-
116
-
117
-
118
-
119
-
120
-
121
-
122
-
123
-
124
-
125
-
126
-
127
-
128
-
129
-
130
-
131
-
132
-
133
-
134
-
135
-
136
-
137
-
138
-
139
-
140
-
141
-
142
-
143
-
144
-
145
-
146
-
147
-
148
-
149
-
150
-
151
-
152
-
153
-
154
-
155
-
156
-
157
-
158
-
159
-
160
-
161
-
162
-
163
-
164
-
165
-
166
-
167
-
168
-
169
-
170
-
171
-
172
-
173
-
174
-
175
-
176
-
177
-
178
-
179
-
180
 |
 |

45Annual Report 2008-2009
The Power of Belief
Management’s Discussion & Analysis
BACKGROUND
The first half of fiscal 2009 was characterised by increasing inflation and interest rates. Equity markets weakened
due to global macroeconomic concerns and a reversal in the pattern of global capital flows. Despite these
developments, the operating environment remained stable with continued corporate investment in India as well
as outbound merger and acquisition activity and robust demand for retail savings and investment products.
The bankruptcy of Lehman Brothers in September 2008 led to a rapid deterioration of the global macroeconomic
environment and a sharp moderation in global economic activity. In India, this impact was felt mainly
through the trade and capital flow channels. As a result, there was a sharp reduction in domestic liquidity in
September–October 2008. The decline in global commodity prices led to a moderation in inflation and facilitated
substantial reductions in key policy rates and reserve requirements. Inflation based on Wholesale Price Index
moderated from a peak of 12.9% in August 2008 to 0.3% at year-end fiscal 2009. Since October 2008, Reserve
Bank of India (RBI) has reduced the cash reserve ratio (CRR) by 400 basis points to 5.0%, the statutory liquidity
ratio (SLR) by 100 basis points to 24.0%, the repo rate by 425 basis points to 4.75% and the reverse repo rate by
275 basis points to 3.25%. The reduction in policy rates led to a reduction in market interest rates with the yield
on 10-year government securities declining by about 320 basis points in the quarter ended December 31, 2008
(Q3-2009). During the quarter ended March 31, 2009 (Q4-2009), the yield on government securities increased
by about 175 basis points following a larger than expected government borrowing programme. Equity markets
continued to remain weak with the BSE Sensex declining from a peak of 17,600 on May 2, 2008 to 9,709 at
year-end fiscal 2009. The rupee depreciated from Rs. 40.12 per US dollar at year-end fiscal 2008 to Rs. 50.72 per
US dollar at year-end fiscal 2009.
The Central Statistical Organisation (CSO) placed GDP growth at 7.8% during the first half of fiscal 2009 compared
to 9.3% during the first half of fiscal 2008. During the third quarter of fiscal 2009, GDP growth moderated to 5.3%
mainly due to a 2.2% decline in agricultural growth and a moderation of industrial sector growth to 0.8%.
The trends in the economy were also reflected in the banking sector. Non-food credit growth in the system
increased to about 30.0% on a year-on-year basis during October-November 2008 from about 22.0% at year-end
fiscal 2008, before moderating significantly to 17.5% at year-end fiscal 2009. Growth in total deposits moderated
from about 24.0% on a year-on-year basis in November 2008 to about 20.0% at year-end fiscal 2009. The growth
in total deposits was due to a 24.0% growth in time deposits in fiscal 2009, as demand deposits in the system
contracted by about 1.0% during fiscal 2009.
Given the uncertain and volatile economic environment, we accorded priority to risk containment, liquidity
management and capital conservation. In view of high asset prices and the increase in interest rates since the
second half of fiscal 2008, we followed a conscious strategy of moderation of retail disbursements, especially
in the unsecured retail loans segment. The weak equity markets and reduction in demand for retail savings and
investment products as also corporate investment and M&A activity during the second half of fiscal 2009 had
a negative impact on our fee and other non-interest income (including dividend from subsidiaries). While we
capitalised on opportunities in the fixed income markets due to reduction in interest rates during Q3-2009, our
equity, fixed income and credit derivative portfolios were negatively impacted due to weaker equity markets,
volatile interest rates and a widening of credit spreads during fiscal 2009.
STANDALONE FINANCIALS AS PER INDIAN GAAP
Summary
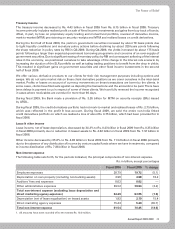
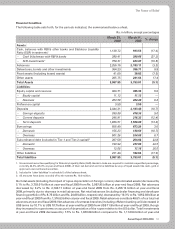
Profit before provisions and tax increased by 12.1% to Rs. 89.25 billion in fiscal 2009 from Rs. 79.61 billion in
fiscal 2008 primarily due to an increase in net interest income by 14.6% to Rs. 83.67 billion in fiscal 2009 from
Rs. 73.04 billion in fiscal 2008 and decrease in non-interest expenses by 13.6% to Rs. 70.45 billion in fiscal 2009 from
Rs. 81.54 billion in fiscal 2008, offset, in part, by decrease in non-interest income by 13.7% to Rs. 76.03 billion in
fiscal 2009 from Rs. 88.11 billion in fiscal 2008. Provisions and contingencies (excluding provision for tax) increased
by 31.1% during fiscal 2009 due to a higher level of specific provisioning on non-performing loans, offset, in part,
by lower general provisioning as the advances portfolio did not increase. Profit before tax increased by 1.2%
to Rs. 51.17 billion in fiscal 2009 from Rs. 50.56 billion in fiscal 2008. Tax provision was Rs. 13.59 billion in fiscal