ICICI Bank 2009 Annual Report Download - page 108
Download and view the complete annual report
Please find page 108 of the 2009 ICICI Bank annual report below. You can navigate through the pages in the report by either clicking on the pages listed below, or by using the keyword search tool below to find specific information within the annual report.-
 1
1 -
2
-
3
-
4
-
5
-
6
-
7
-
8
-
9
-
10
-
11
-
12
-
13
-
14
-
15
-
16
-
17
-
18
-
19
-
20
-
21
-
22
-
23
-
24
-
25
-
26
-
27
-
28
-
29
-
30
-
31
-
32
-
33
-
34
-
35
-
36
-
37
-
38
-
39
-
40
-
41
-
42
-
43
-
44
-
45
-
46
-
47
-
48
-
49
-
50
-
51
-
52
-
53
-
54
-
55
-
56
-
57
-
58
-
59
-
60
-
61
-
62
-
63
-
64
-
65
-
66
-
67
-
68
-
69
-
70
-
71
-
72
-
73
-
74
-
75
-
76
-
77
-
78
-
79
-
80
-
81
-
82
-
83
-
84
-
85
-
86
-
87
-
88
-
89
-
90
-
91
-
92
-
93
-
94
-
95
-
96
-
97
-
 98
98 -
 99
99 -
 100
100 -
 101
101 -
 102
102 -
 103
103 -
 104
104 -
 105
105 -
 106
106 -
 107
107 -
 108
108 -
 109
109 -
 110
110 -
 111
111 -
 112
112 -
 113
113 -
 114
114 -
 115
115 -
 116
116 -
 117
117 -
 118
118 -
119
-
120
-
121
-
122
-
123
-
124
-
125
-
126
-
127
-
128
-
129
-
130
-
131
-
132
-
133
-
134
-
135
-
136
-
137
-
138
-
139
-
140
-
141
-
142
-
143
-
144
-
145
-
146
-
147
-
148
-
149
-
150
-
151
-
152
-
153
-
154
-
155
-
156
-
157
-
158
-
159
-
160
-
161
-
162
-
163
-
164
-
165
-
166
-
167
-
168
-
169
-
170
-
171
-
172
-
173
-
174
-
175
-
176
-
177
-
178
-
179
-
180
 |
 |

F34
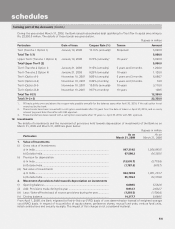
As on
March 31, 2009 As on
March 31, 2008
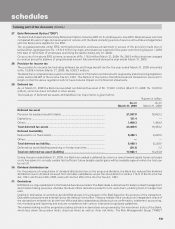
v) Secured and unsecured advances to stockbrokers and guarantees issued on
behalf of stockbrokers and market makers122,890.5 26,342.6
vi) Loans sanctioned to corporates against the security of shares/bonds/
debentures or other securities or on clean basis for meeting promoter’s
contribution to the equity of new companies in anticipation of raising
resources ——
vii) Bridge loans to companies against expected equity flows/issues ——
viii) Underwriting commitments taken up by the Bank in respect of primary issue
of shares or convertible bonds or convertible debentures or units of equity
oriented mutual funds ——
ix) Financing to stockbrokers for margin trading ——
x) All exposures to Venture Capital Funds (both registered and unregistered) 13,564.3 12,805.2
xi) Others 3,922.2 —
Total 61,834.8 84,828.1
1. Includes a guarantee of Rs. Nil (March 31, 2008: Rs. 3,040.0 million) issued on behalf of a corporate customer to ensure equity capital
contribution.
The summary of lending to real estate sector is given below:
Rupees in million
As on
March 31, 2009 As on
March 31, 2008
Real estate sector
I Direct exposure .............................................................................................. 697,579.8 779,388.9
i) Residential mortgages ........................................................................... 545,263.3 630,857.6
of which; individual housing loans eligible for priority sector advances 266,820.6 314,071.6
ii) Commercial real estate1 .......................................................................... 142,441.7 137,336.2
iii) Investments in mortgage backed securities (MBS) and other
securitised exposure ............................................................................... 9,874.8 11,195.1
a. Residential ............................................................................................... 9,874.8 11,195.1
b. Commercial real estate ........................................................................... ——
II Indirect exposure ........................................................................................... 70,441.1 33,613.5
Fund based and non-fund based exposures on National Housing Bank
(NHB) and Housing Finance Companies (HFCs) ............................................. 66,477.4 20,901.3
Others ............................................................................................................. 3,963.7 12,712.2
Total2 ............................................................................................................... 768,020.9 813,002.4
1. Commercial real estate exposure includes loans given to land and building developers for construction, corporates for their real estate
requirements, corporates for development of SEZs and to individuals/firms/corporates against non-residential premises.
2. Excludes non-banking assets acquired in satisfaction of claims.
16. Details of Single Borrower Limit (“SBL”), Group Borrower Limit (“GBL”) exceeded by the Bank
During the year ended March 31, 2009, the Bank had no exposure to any single borrower and group borrower, which
exceeded the prudential exposure limits prescribed by RBI.
17. Risk category-wise country-wise exposure
As per the extant RBI guidelines, the country exposure of the Bank is categorised into various risk categories listed in
the following table. The funded country exposure (net) of the Bank in respect of United Kingdom is 1.22%, United States
of America is 1.34% and Canada is 1.05% of the total funded assets as on March 31, 2009 (as on March 31, 2008:
United Kingdom was 1.81%, United States of America was 1.57% and Canada was 0.43%). As the net funded exposure to
United Kingdom, United States of America and Canada exceeds 1% of total funded assets, the Bank has made a provision
of Rs. 285.0 million on country exposure as on March 31, 2009 (Provision as on March 31, 2008: Rs. 245.0 million).
forming part of the Accounts (Contd.)
schedules