ICICI Bank 2009 Annual Report Download - page 104
Download and view the complete annual report
Please find page 104 of the 2009 ICICI Bank annual report below. You can navigate through the pages in the report by either clicking on the pages listed below, or by using the keyword search tool below to find specific information within the annual report.-
 1
1 -
2
-
3
-
4
-
5
-
6
-
7
-
8
-
9
-
10
-
11
-
12
-
13
-
14
-
15
-
16
-
17
-
18
-
19
-
20
-
21
-
22
-
23
-
24
-
25
-
26
-
27
-
28
-
29
-
30
-
31
-
32
-
33
-
34
-
35
-
36
-
37
-
38
-
39
-
40
-
41
-
42
-
43
-
44
-
45
-
46
-
47
-
48
-
49
-
50
-
51
-
52
-
53
-
54
-
55
-
56
-
57
-
58
-
59
-
60
-
61
-
62
-
63
-
64
-
65
-
66
-
67
-
68
-
69
-
70
-
71
-
72
-
73
-
74
-
75
-
76
-
77
-
78
-
79
-
80
-
81
-
82
-
83
-
84
-
85
-
86
-
87
-
88
-
89
-
90
-
91
-
92
-
93
-
 94
94 -
 95
95 -
 96
96 -
 97
97 -
 98
98 -
 99
99 -
 100
100 -
 101
101 -
 102
102 -
 103
103 -
 104
104 -
 105
105 -
 106
106 -
 107
107 -
 108
108 -
 109
109 -
 110
110 -
 111
111 -
 112
112 -
 113
113 -
 114
114 -
115
-
116
-
117
-
118
-
119
-
120
-
121
-
122
-
123
-
124
-
125
-
126
-
127
-
128
-
129
-
130
-
131
-
132
-
133
-
134
-
135
-
136
-
137
-
138
-
139
-
140
-
141
-
142
-
143
-
144
-
145
-
146
-
147
-
148
-
149
-
150
-
151
-
152
-
153
-
154
-
155
-
156
-
157
-
158
-
159
-
160
-
161
-
162
-
163
-
164
-
165
-
166
-
167
-
168
-
169
-
170
-
171
-
172
-
173
-
174
-
175
-
176
-
177
-
178
-
179
-
180
 |
 |

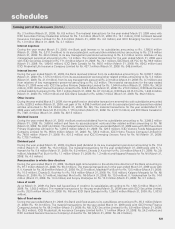
F30
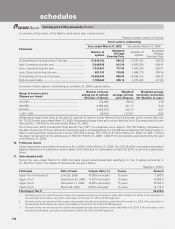
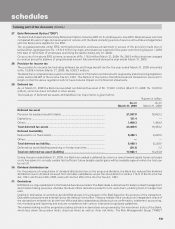
A summary of the status of the Bank’s stock option plan is given below:
Rupees, except number of options
Particulars
Stock options outstanding
Year ended March 31, 2009 Year ended March 31, 2008
Number of
options
Weighted
Average
Exercise Price
Number of
options
Weighted
Average
Exercise Price
Outstanding at the beginning of the year ....................... 15,638,152 596.32 13,187,783 442.50
Add: Granted during the year ......................................... 5,640,500 912.30 4,956,300 938.41
Less: Lapsed during the year ......................................... 1,723,001 737.40 1,037,218 582.51
Less: Exercised during the year ..................................... 563,147 336.96 1,468,713 379.34
Outstanding at the end of the year ................................. 18,992,504 685.05 15,638,152 596.32
Options exercisable ........................................................ 7,188,420 496.10 3,272,292 411.89
Summary of stock options outstanding as on March 31, 2009 is given below:
Range of exercise price
(Rupees per share)
Number of shares
arising out of options
(Number of shares)
Weighted
average exercise
price (Rupees)
Weighted average
remaining contractual
life (Number of years)
105-299 ................................................................... 136,682 150.53 2.79
300-599 ................................................................... 9,384,822 451.17 6.34
600-999 ................................................................... 9,403,000 923.15 8.61
1,000-1,399 ............................................................. 68,000 1,114.57 8.65
Weighted average share price at the date of exercise of options as per National Stock Exchange price volume data was
Rs. 723.55 for the year ended March 31, 2009. Weighted average share price as per National Stock Exchange price volume
data was Rs. 1,044.02 for the year ended March 31, 2008.
The Finance Act, 2007 introduced Fringe Benefit Tax (“FBT”) on employee stock options. The FBT liability crystallises on
the date of exercise of stock options by employees and is computed based on the difference between fair market value on
date of vesting and the exercise price. As per the ESOS scheme, FBT of Rs 81.9 million (March 31, 2008: Rs. 226.7 million)
has been recovered from the employees on 563,147 (March 31, 2008: 1,468,713) stock options exercised during the year
ended March 31, 2009.
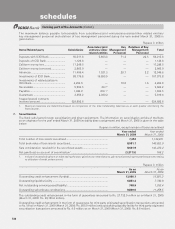
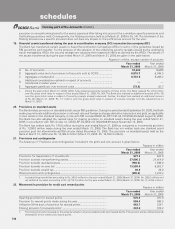
10. Preference shares
Certain government securities amounting to Rs. 2,356.6 million (March 31, 2008: Rs. 2,331.8 million) have been earmarked
against redemption of preference share capital, which falls due for redemption on April 20, 2018, as per the original issue
terms.
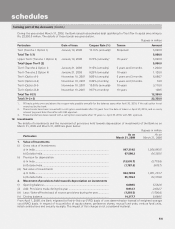
11. Subordinated debt
During the year ended March 31, 2009, the Bank raised subordinated debt qualifying for Tier II capital amounting to
Rs. 45,210.0 million. The details of these bonds are given below:
Rupees in million
Particulars Date of Issue Coupon Rate (%) Tenure Amount
Upper Tier II (Tranche 3) June 20, 2008 10.00% (annually)115 years 7,500.0
Upper Tier II September 22, 2008 11.25% (annually)115 years 10,000.0
Upper Tier II November 11, 2008 12.00% (annually)215 years 15,000.0
Upper Tier II March 26, 2009 9.95% (annually)315 years 12,710.0
Total Upper Tier II 45,210.0
1. 50 basis points over and above the coupon rate payable annually for the balance years after October 31, 2018, if the call option is
not exercised by the Bank, call option exercisable on October 31, 2018 with RBI approval.
2. 50 basis points over and above the coupon rate payable annually for the balance years after November 30, 2018, if the call option is
not exercised by the Bank, call option exercisable on November 30, 2018 with RBI approval.
3. 50 basis points over and above the coupon rate payable annually for the balance years after March 26, 2019, if the call option is not
exercised by the Bank, call option exercisable on March 26, 2019 with RBI approval.
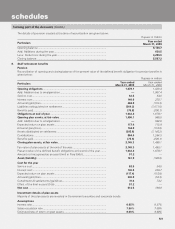
forming part of the Accounts (Contd.)
schedules