ICICI Bank 2009 Annual Report Download - page 48
Download and view the complete annual report
Please find page 48 of the 2009 ICICI Bank annual report below. You can navigate through the pages in the report by either clicking on the pages listed below, or by using the keyword search tool below to find specific information within the annual report.-
 1
1 -
2
-
3
-
4
-
5
-
6
-
7
-
8
-
9
-
10
-
11
-
12
-
13
-
14
-
15
-
16
-
17
-
18
-
19
-
20
-
21
-
22
-
23
-
24
-
25
-
26
-
27
-
28
-
29
-
30
-
31
-
32
-
33
-
34
-
35
-
36
-
37
-
 38
38 -
 39
39 -
 40
40 -
 41
41 -
 42
42 -
 43
43 -
 44
44 -
 45
45 -
 46
46 -
 47
47 -
 48
48 -
 49
49 -
 50
50 -
 51
51 -
 52
52 -
 53
53 -
 54
54 -
 55
55 -
 56
56 -
 57
57 -
 58
58 -
59
-
60
-
61
-
62
-
63
-
64
-
65
-
66
-
67
-
68
-
69
-
70
-
71
-
72
-
73
-
74
-
75
-
76
-
77
-
78
-
79
-
80
-
81
-
82
-
83
-
84
-
85
-
86
-
87
-
88
-
89
-
90
-
91
-
92
-
93
-
94
-
95
-
96
-
97
-
98
-
99
-
100
-
101
-
102
-
103
-
104
-
105
-
106
-
107
-
108
-
109
-
110
-
111
-
112
-
113
-
114
-
115
-
116
-
117
-
118
-
119
-
120
-
121
-
122
-
123
-
124
-
125
-
126
-
127
-
128
-
129
-
130
-
131
-
132
-
133
-
134
-
135
-
136
-
137
-
138
-
139
-
140
-
141
-
142
-
143
-
144
-
145
-
146
-
147
-
148
-
149
-
150
-
151
-
152
-
153
-
154
-
155
-
156
-
157
-
158
-
159
-
160
-
161
-
162
-
163
-
164
-
165
-
166
-
167
-
168
-
169
-
170
-
171
-
172
-
173
-
174
-
175
-
176
-
177
-
178
-
179
-
180
 |
 |

46
Management’s Discussion and Analysis
2009 compared to Rs. 8.98 billion in fiscal 2008, due to the higher effective tax rate consequent to a change in
mix of taxable profits, which had a lower component of income from dividend and capital gains. Profit after tax
decreased by 9.6% to Rs. 37.58 billion in fiscal 2009 from Rs. 41.58 billion in fiscal 2008.
Net interest income increased by 14.6% to Rs. 83.67 billion in fiscal 2009 from Rs. 73.04 billion in fiscal 2008,
reflecting primarily an increase in net interest margin by 21 basis points to 2.4% in fiscal 2009 compared to 2.2%
in fiscal 2008 and increase in average interest-earning assets to Rs. 3,436.20 billion in fiscal 2009 from Rs. 3,288.34
billion in fiscal 2008.
Non-interest income decreased by 13.7% to Rs. 76.03 billion in fiscal 2009 from Rs. 88.11 billion in fiscal 2008
primarily due to decrease in other income (including dividend from subsidiaries) by 65.0% to Rs. 4.03 billion in
fiscal 2009 from Rs. 11.52 billion in fiscal 2008.
Non-interest expense decreased by 13.6% to Rs. 70.45 billion in fiscal 2009 from Rs. 81.54 billion in fiscal 2008
primarily due to decrease in direct marketing agency expenses to Rs. 5.29 billion in fiscal 2009 from Rs. 15.43
billion in fiscal 2008 and due to overall cost reduction initiatives undertaken by us.
Provisions and contingencies (excluding provision for tax) increased to Rs. 38.08 billion in fiscal 2009 from
Rs. 29.05 billion in fiscal 2008 primarily due to higher level of specific provisioning on non-performing retail loans.
Increase in retail non-performing assets was primarily on account of seasoning of the secured loan portfolio,
relatively higher losses on unsecured portfolio and the adverse macro-economic environment.
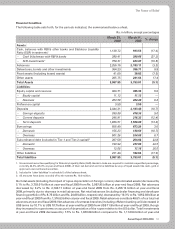
Total assets decreased by 5.1% to Rs. 3,793.01 billion at year-end fiscal 2009 from Rs. 3,997.95 billion at year-end
fiscal 2008 primarily due to decrease in cash and balances with RBI by Rs. 118.41 billion due to reduction in CRR
requirement, decrease in investments by Rs. 83.96 billion and decrease in advances by Rs. 73.05 billion.
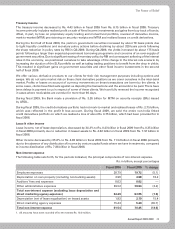
Operating results data
The following table sets forth, for the periods indicated, the operating results data.
Rs. in billion, except percentages
Fiscal 2008 Fiscal 2009 % change
Interest income, gross of amortisation of premium on
government securities 316.86 318.18 0.4
Less: amortisation of premium on government securities 8.98 7.25 (19.3)
Interest income 307.88 310.93 1.0
Interest expense 234.84 227.26 (3.2)
Net interest income 73.04 83.67 14.6
Non-interest income 88.11 76.03 (13.7)
– Fee income166.27 65.24 (1.6)
– Treasury income 8.15 4.43 (45.6)
– Lease income 2.17 2.33 7.4
– Others 11.52 4.03 (65.0)
Operating income 161.15 159.70 (0.9)
Operating expenses 64.29 63.06 (1.9)
Direct marketing agency (DMA) expense215.43 5.29 (65.7)
Lease depreciation, net of lease equalisation 1.82 2.10 15.4
Operating profit 79.61 89.25 12.1
Provisions, net of write-backs 29.05 38.08 31.1
Profit before tax 50.56 51.17 1.2
Tax, net of deferred tax 8.98 13.59 51.3
Profit after tax 41.58 37.58 (9.6)
1. Includes merchant foreign exchange income and margin on customer derivative transactions.
2. Represents commissions paid to direct marketing agents (DMAs) for origination of retail loans. These commissions are expensed
upfront.
3. All amounts have been rounded off to the nearest Rs. 10.0 million.
4. Prior period figures have been re-grouped/re-arranged, where necessary.