ICICI Bank 2009 Annual Report Download - page 93
Download and view the complete annual report
Please find page 93 of the 2009 ICICI Bank annual report below. You can navigate through the pages in the report by either clicking on the pages listed below, or by using the keyword search tool below to find specific information within the annual report.-
 1
1 -
2
-
3
-
4
-
5
-
6
-
7
-
8
-
9
-
10
-
11
-
12
-
13
-
14
-
15
-
16
-
17
-
18
-
19
-
20
-
21
-
22
-
23
-
24
-
25
-
26
-
27
-
28
-
29
-
30
-
31
-
32
-
33
-
34
-
35
-
36
-
37
-
38
-
39
-
40
-
41
-
42
-
43
-
44
-
45
-
46
-
47
-
48
-
49
-
50
-
51
-
52
-
53
-
54
-
55
-
56
-
57
-
58
-
59
-
60
-
61
-
62
-
63
-
64
-
65
-
66
-
67
-
68
-
69
-
70
-
71
-
72
-
73
-
74
-
75
-
76
-
77
-
78
-
79
-
80
-
81
-
82
-
 83
83 -
 84
84 -
 85
85 -
 86
86 -
 87
87 -
 88
88 -
 89
89 -
 90
90 -
 91
91 -
 92
92 -
 93
93 -
 94
94 -
 95
95 -
 96
96 -
 97
97 -
 98
98 -
 99
99 -
 100
100 -
 101
101 -
 102
102 -
 103
103 -
104
-
105
-
106
-
107
-
108
-
109
-
110
-
111
-
112
-
113
-
114
-
115
-
116
-
117
-
118
-
119
-
120
-
121
-
122
-
123
-
124
-
125
-
126
-
127
-
128
-
129
-
130
-
131
-
132
-
133
-
134
-
135
-
136
-
137
-
138
-
139
-
140
-
141
-
142
-
143
-
144
-
145
-
146
-
147
-
148
-
149
-
150
-
151
-
152
-
153
-
154
-
155
-
156
-
157
-
158
-
159
-
160
-
161
-
162
-
163
-
164
-
165
-
166
-
167
-
168
-
169
-
170
-
171
-
172
-
173
-
174
-
175
-
176
-
177
-
178
-
179
-
180
 |
 |

F19
For the year ended March 31, 2008
Particulars Retail
Banking Wholesale
Banking
Treasury/
Investment
Banking
Other
Banking
Business Total
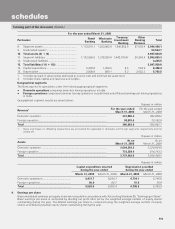
8. Segment assets .............................................. 1,112,510.1 1,263,992.0 1,540,852.6 27,053.4 3,944,408.1
9. Unallocated assets1 ......................................... 53,542.7
10. Total assets (8) + (9) ..................................... 3,997,950.8
11. Segment liabilities .......................................... 1,152,965.5 1,378,224.6 1,442,104.8220,360.4 3,993,655.3
12. Unallocated liabilities ...................................... 4,295.5
13. Total liabilities (11) + (12) ............................. 3,997,950.8
14. Capital expenditure ......................................... 6,430.8 1,364.6 8.5 504.5 8,308.4
15. Depreciation .................................................... 2,836.8 889.1 5.3 2,052.3 5,783.5
1. Includes tax paid in advance/tax deducted at source (net) and deferred tax asset (net).
2. Includes share capital and reserves and surplus.
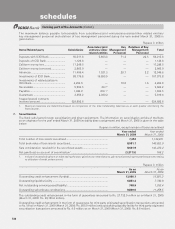
Geographical segments
The Bank reports its operations under the following geographical segments.
Domestic operations comprises branches having operations in India.
Foreign operations comprises branches having operations outside India and offshore banking unit having operations
in India.
Geographical segment results are given below:
Rupees in million
Revenue1For the year ended
March 31, 2009 For the year ended
March 31, 2008
Domestic operation ........................................................................................ 347,986.2 362,828.2
Foreign operation ............................................................................................ 38,976.6 33,162.9
Total ................................................................................................................ 386,962.8 395,991.1
1. Gains and losses on offsetting transactions are accounted for separately in domestic and foreign segments respectively and not
netted off.
Rupees in million
Assets As on
March 31, 2009 As on
March 31, 2008
Domestic operation ........................................................................................ 3,004,203.2 3,329,664.8
Foreign operation ............................................................................................ 733,259.4 614,743.3
Total ................................................................................................................ 3,737,462.6 3,944,408.1
Rupees in million
Capital expenditure incurred
during the year ended Depreciation provided
during the year ended
March 31, 2009 March 31, 2008 March 31, 2009 March 31, 2008
Domestic operations ....................................... 5,431.7 8,244.3 6,734.1 5,746.6
Foreign operations .......................................... 96.9 64.1 51.9 36.9
Total ................................................................ 5,528.6 8,308.4 6,786.0 5,783.5
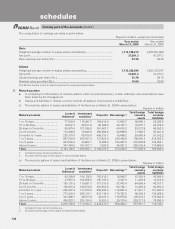
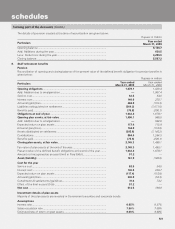
4. Earnings per share
Basic and diluted earnings per equity share are computed in accordance with Accounting Standard 20, “Earnings per Share”.
Basic earnings per share is computed by dividing net profit after tax by the weighted average number of equity shares
outstanding during the year. The diluted earnings per share is computed using the weighted average number of equity
shares and dilutive potential equity shares outstanding during the year.
forming part of the Accounts (Contd.)
schedules