ICICI Bank 2009 Annual Report Download - page 147
Download and view the complete annual report
Please find page 147 of the 2009 ICICI Bank annual report below. You can navigate through the pages in the report by either clicking on the pages listed below, or by using the keyword search tool below to find specific information within the annual report.-
 1
1 -
2
-
3
-
4
-
5
-
6
-
7
-
8
-
9
-
10
-
11
-
12
-
13
-
14
-
15
-
16
-
17
-
18
-
19
-
20
-
21
-
22
-
23
-
24
-
25
-
26
-
27
-
28
-
29
-
30
-
31
-
32
-
33
-
34
-
35
-
36
-
37
-
38
-
39
-
40
-
41
-
42
-
43
-
44
-
45
-
46
-
47
-
48
-
49
-
50
-
51
-
52
-
53
-
54
-
55
-
56
-
57
-
58
-
59
-
60
-
61
-
62
-
63
-
64
-
65
-
66
-
67
-
68
-
69
-
70
-
71
-
72
-
73
-
74
-
75
-
76
-
77
-
78
-
79
-
80
-
81
-
82
-
83
-
84
-
85
-
86
-
87
-
88
-
89
-
90
-
91
-
92
-
93
-
94
-
95
-
96
-
97
-
98
-
99
-
100
-
101
-
102
-
103
-
104
-
105
-
106
-
107
-
108
-
109
-
110
-
111
-
112
-
113
-
114
-
115
-
116
-
117
-
118
-
119
-
120
-
121
-
122
-
123
-
124
-
125
-
126
-
127
-
128
-
129
-
130
-
131
-
132
-
133
-
134
-
135
-
136
-
 137
137 -
 138
138 -
 139
139 -
 140
140 -
 141
141 -
 142
142 -
 143
143 -
 144
144 -
 145
145 -
 146
146 -
 147
147 -
 148
148 -
 149
149 -
 150
150 -
 151
151 -
 152
152 -
 153
153 -
 154
154 -
 155
155 -
 156
156 -
 157
157 -
158
-
159
-
160
-
161
-
162
-
163
-
164
-
165
-
166
-
167
-
168
-
169
-
170
-
171
-
172
-
173
-
174
-
175
-
176
-
177
-
178
-
179
-
180
 |
 |

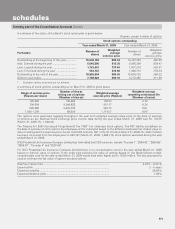
F73
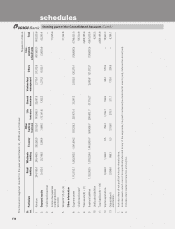
A summary of stock options outstanding as on March 31, 2009 is given below.
Range of exercise price
(Rupees per share) Number of shares arising
out of options
(Number of shares)
Weighted average
exercise price
(Rupees)
Weighted average
remaining contractual life
(Number of years)
35 – 200 14,398,162 94.19 8.79
As per the ESOS scheme, FBT of Rs. 16.5 million (March 31, 2008: Rs. 0.8 million) has been recovered from the employees
on 783,828 (March 31, 2008: 150,240) stock options exercised during the year ended March 31, 2009.
If the Group had used the fair value of options based on the Black-Scholes model, the compensation cost for the year
ended March 31, 2009 would have been higher by Rs. 1,828.4 million and the proforma consolidated profit after tax would
have been Rs. 33,941.1 million. On a proforma basis, the Group’s basic and diluted earnings per share would have been
Rs. 30.49 and Rs. 30.43 respectively.
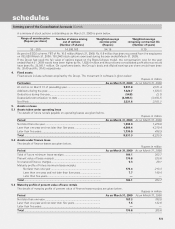
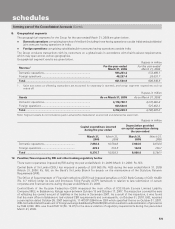
4. Fixed assets
Fixed assets include software acquired by the Group. The movement in software is given below.
Rupees in million
Particulars As on March 31, 2009 As on March 31, 2008
At cost as on March 31 of preceding year .............................................. 5,631.8 4,101.4
Additions during the year ......................................................................... 1,329.7 1,533.5
Deductions during the year...................................................................... (54.8) (3.1)
Depreciation/amortisation to date ........................................................... (4,385.1) (3,470.7)
Net Block .................................................................................................. 2,521.6 2,161.1
5. Assets on lease
5.1 Assets taken under operating lease
The details of future rentals payable on operating leases are given below.
Rupees in million
Period As on March 31, 2009 As on March 31, 2008
Not later than one year ........................................................................... 1,896.0 1,476.6
Later than one year and not later than five years ................................... 4,904.4 4,310.4
Later than five years ................................................................................ 1,730.9 438.9
Total ........................................................................................................ 8,531.3 6,225.9
5.2 Assets under finance lease
The details of finance leases are given below. Rupees in million
Period As on March 31, 2009 As on March 31, 2008
Total of future minimum lease receipts ................................................... 184.1 353.7
Present value of lease receipts ................................................................ 174.8 325.6
Un-matured finance charges.................................................................... 9.3 28.1
Maturity profile of future minimum lease receipts
Not later than one year .................................................................... 176.4 213.3
Later than one year and not later than five years ............................ 7.7 140.4
Later than five years ......................................................................... ——
Total ......................................................................................................... 184.1 353.7
5.3 Maturity profile of present value of lease rentals
The details of maturity profile of present value of finance lease receipts are given below. Rupees in million
Period As on March 31, 2009 As on March 31, 2008
Not later than one year ........................................................................... 167.3 193.0
Later than one year and not later than five years ................................... 7.5 132.6
Later than five years ................................................................................ ——
Total ........................................................................................................ 174.8 325.6
forming part of the Consolidated Accounts (Contd.)
schedules