ICICI Bank 2009 Annual Report Download - page 166
Download and view the complete annual report
Please find page 166 of the 2009 ICICI Bank annual report below. You can navigate through the pages in the report by either clicking on the pages listed below, or by using the keyword search tool below to find specific information within the annual report.-
 1
1 -
2
-
3
-
4
-
5
-
6
-
7
-
8
-
9
-
10
-
11
-
12
-
13
-
14
-
15
-
16
-
17
-
18
-
19
-
20
-
21
-
22
-
23
-
24
-
25
-
26
-
27
-
28
-
29
-
30
-
31
-
32
-
33
-
34
-
35
-
36
-
37
-
38
-
39
-
40
-
41
-
42
-
43
-
44
-
45
-
46
-
47
-
48
-
49
-
50
-
51
-
52
-
53
-
54
-
55
-
56
-
57
-
58
-
59
-
60
-
61
-
62
-
63
-
64
-
65
-
66
-
67
-
68
-
69
-
70
-
71
-
72
-
73
-
74
-
75
-
76
-
77
-
78
-
79
-
80
-
81
-
82
-
83
-
84
-
85
-
86
-
87
-
88
-
89
-
90
-
91
-
92
-
93
-
94
-
95
-
96
-
97
-
98
-
99
-
100
-
101
-
102
-
103
-
104
-
105
-
106
-
107
-
108
-
109
-
110
-
111
-
112
-
113
-
114
-
115
-
116
-
117
-
118
-
119
-
120
-
121
-
122
-
123
-
124
-
125
-
126
-
127
-
128
-
129
-
130
-
131
-
132
-
133
-
134
-
135
-
136
-
137
-
138
-
139
-
140
-
141
-
142
-
143
-
144
-
145
-
146
-
147
-
148
-
149
-
150
-
151
-
152
-
153
-
154
-
155
-
 156
156 -
 157
157 -
 158
158 -
 159
159 -
 160
160 -
 161
161 -
 162
162 -
 163
163 -
 164
164 -
 165
165 -
 166
166 -
 167
167 -
 168
168 -
 169
169 -
 170
170 -
 171
171 -
 172
172 -
 173
173 -
 174
174 -
 175
175 -
 176
176 -
177
-
178
-
179
-
180
 |
 |

F92
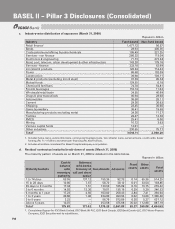
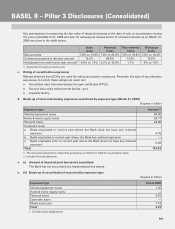
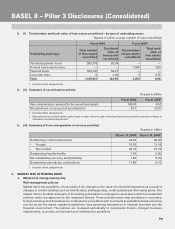
c. Industry-wise distribution of exposures (March 31, 2009)
Rupees in billion
Industry Fund-based Non-fund based
Retail finance11,477.12 50.57
Banks 28.93 406.36
Crude petroleum/refining & petrochemicals 195.49 221.25
Services - non finance 280.32 113.09
Electronics & engineering 71.73 273.34
Road, port, telecom, urban development & other infrastructure 143.20 178.16
Services - finance 233.10 62.69
Iron/steel & products 126.24 114.42
Power 88.68 102.09
Construction 39.90 103.11
Metal & products (excluding iron & steel) 37.59 95.54
Mutual funds 129.55 0.18
Chemical & fertilisers 74.70 54.81
Food & beverages 110.14 11.62
Wholesale/retail trade 34.55 46.69
Drugs & pharmaceuticals 46.94 28.68
Automobiles 38.30 28.11
Cement 29.36 30.83
Shipping 22.45 36.60
Gems & jewellery 38.41 19.58
Manufacturing products excluding metal 34.26 11.27
Textiles 28.47 13.56
FMCG 25.41 6.06
Mining 16.72 3.83
Venture capital funds 12.01 —
Other industries 230.55 75.77
Total23,594.11 2,088.20
1. Includes home loans, automobile loans, commercial business loans, two wheeler loans, personal loans, credit cards, dealer
funding (Rs. 11.11 billion) and developer financing (Rs. 49.07 billion).
2. Includes all entities considered for Basel II capital adequacy computation.
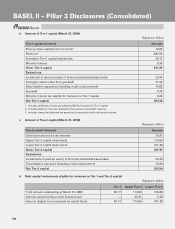
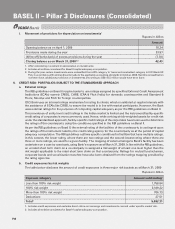
d. Residual contractual maturity break-down of assets (March 31, 2009)
The maturity pattern of assets as on March 31, 2009 is detailed in the table below.
Rupees in billion
Maturity buckets
Cash &
balance
with
monetary
authority
Balances
with banks
& money at
call and short
notice
Investments Advances
Fixed
assets
Other
assets Total
assets
1 to 14 days 63.55 137.12 155.35 92.73 0.14 65.36 514.25
15 to 28 days 10.80 7.67 58.72 28.12 0.01 33.54 138.85
29 days to 3 months 17.34 7.51 133.58 105.08 0.16 15.75 279.42
3 to 6 months 14.02 12.30 79.57 135.16 0.29 5.20 246.53
6 months to 1 year 17.23 4.92 103.82 258.43 2.84 7.41 394.64
1 to 3 years 40.60 1.90 334.89 993.96 0.62 14.68 1,386.68
3 to 5 years 2.22 — 56.78 572.66 0.20 5.27 637.12
Above 5 years 10.07 — 253.58 475.68 35.02 112.88 887.19
Total1175.83 171.42 1,176.28 2,661.80 39.27 260.08 4,484.69
1. Consolidated figures for ICICI Bank Limited, ICICI Bank UK PLC, ICICI Bank Canada, ICICI Bank Eurasia LLC, ICICI Home Finance
Company, ICICI Securities and its subsidiaries.
BASEL II – Pillar 3 Disclosures (Consolidated)