ICICI Bank 2009 Annual Report Download - page 171
Download and view the complete annual report
Please find page 171 of the 2009 ICICI Bank annual report below. You can navigate through the pages in the report by either clicking on the pages listed below, or by using the keyword search tool below to find specific information within the annual report.-
 1
1 -
2
-
3
-
4
-
5
-
6
-
7
-
8
-
9
-
10
-
11
-
12
-
13
-
14
-
15
-
16
-
17
-
18
-
19
-
20
-
21
-
22
-
23
-
24
-
25
-
26
-
27
-
28
-
29
-
30
-
31
-
32
-
33
-
34
-
35
-
36
-
37
-
38
-
39
-
40
-
41
-
42
-
43
-
44
-
45
-
46
-
47
-
48
-
49
-
50
-
51
-
52
-
53
-
54
-
55
-
56
-
57
-
58
-
59
-
60
-
61
-
62
-
63
-
64
-
65
-
66
-
67
-
68
-
69
-
70
-
71
-
72
-
73
-
74
-
75
-
76
-
77
-
78
-
79
-
80
-
81
-
82
-
83
-
84
-
85
-
86
-
87
-
88
-
89
-
90
-
91
-
92
-
93
-
94
-
95
-
96
-
97
-
98
-
99
-
100
-
101
-
102
-
103
-
104
-
105
-
106
-
107
-
108
-
109
-
110
-
111
-
112
-
113
-
114
-
115
-
116
-
117
-
118
-
119
-
120
-
121
-
122
-
123
-
124
-
125
-
126
-
127
-
128
-
129
-
130
-
131
-
132
-
133
-
134
-
135
-
136
-
137
-
138
-
139
-
140
-
141
-
142
-
143
-
144
-
145
-
146
-
147
-
148
-
149
-
150
-
151
-
152
-
153
-
154
-
155
-
156
-
157
-
158
-
159
-
160
-
 161
161 -
 162
162 -
 163
163 -
 164
164 -
 165
165 -
 166
166 -
 167
167 -
 168
168 -
 169
169 -
 170
170 -
 171
171 -
 172
172 -
 173
173 -
 174
174 -
 175
175 -
 176
176 -
 177
177 -
 178
178 -
 179
179 -
 180
180
 |
 |

F97
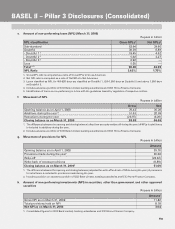
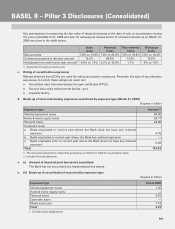
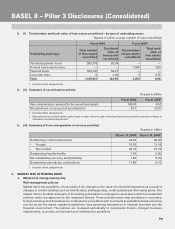
Key assumptions in measuring the fair value of retained interests at the date of sale or securitisation during
the year ended March 31, 2009 and also for subsequent measurement of retained interests as on March 31,
2009 are given in the table below.
Auto
loans Personal
loans Two wheeler
loans Mortgage
loans
Discount rate 7.0% to 15.8% 7.0% to 25.6% 7.0% to 18.8% 7.0% to 10.2%
Constant prepayment rate (per annum) 15.0% 42.0% 12.0% 10.0%
Anticipated net credit losses (per annum)10.4% to 1.4% 3.2% to 10.0% 1.1% 0% to 1.0%
1. Applicable for single product pools.
c. Rating of securitisation exposures
Ratings obtained from ECAIs are used for rating securisation exposures. Presently, the type of securitisation
exposures, for which these ratings are used, are:
Securitized debt instruments/pass through certificates (PTCs);
Second loss credit enhancement facility ; and
Liquidity facility.
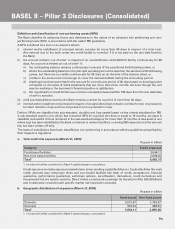
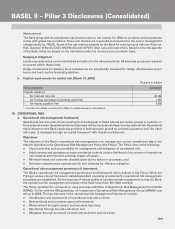
d. Break-up of total outstanding exposures securitised by exposure type (March 31, 2009)
Rupees in billion
Exposure type Amount1,2
Vehicle/equipment loans 69.05
Home & home equity loans 29.77
Personal loans 24.06
Corporate loans
a. Deals originated in current year where the Bank does not have any retained
exposure 4.75
b. Deals originated in current year where the Bank has retained exposure —
c. Deals originated prior to current year where the Bank does not have any retained
exposure 6.20
Total 133.83
1. The amounts represent the outstanding principal as on March 31, 2009 for securitisation deals.
2. Includes direct assignments.
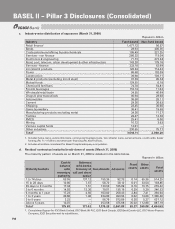
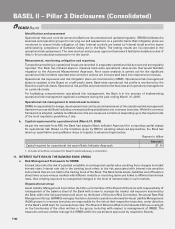
e. (i) Amount of impaired/past due assets securitized
The Bank has not securitized any impaired/past due assets.
e. (ii) Break-up of securitisation losses (net) by exposure type
Rupees in billion
Exposure type Fiscal 2009
Vehicle/equipment loans 1.35
Home & home equity loans —
Personal loans 0.67
Corporate loans —
Mixed asset pool 1.19
Total13.21
1. Includes direct assignments.
BASEL II – Pillar 3 Disclosures (Consolidated)