ICICI Bank 2009 Annual Report Download - page 50
Download and view the complete annual report
Please find page 50 of the 2009 ICICI Bank annual report below. You can navigate through the pages in the report by either clicking on the pages listed below, or by using the keyword search tool below to find specific information within the annual report.-
 1
1 -
2
-
3
-
4
-
5
-
6
-
7
-
8
-
9
-
10
-
11
-
12
-
13
-
14
-
15
-
16
-
17
-
18
-
19
-
20
-
21
-
22
-
23
-
24
-
25
-
26
-
27
-
28
-
29
-
30
-
31
-
32
-
33
-
34
-
35
-
36
-
37
-
38
-
39
-
 40
40 -
 41
41 -
 42
42 -
 43
43 -
 44
44 -
 45
45 -
 46
46 -
 47
47 -
 48
48 -
 49
49 -
 50
50 -
 51
51 -
 52
52 -
 53
53 -
 54
54 -
 55
55 -
 56
56 -
 57
57 -
 58
58 -
 59
59 -
 60
60 -
61
-
62
-
63
-
64
-
65
-
66
-
67
-
68
-
69
-
70
-
71
-
72
-
73
-
74
-
75
-
76
-
77
-
78
-
79
-
80
-
81
-
82
-
83
-
84
-
85
-
86
-
87
-
88
-
89
-
90
-
91
-
92
-
93
-
94
-
95
-
96
-
97
-
98
-
99
-
100
-
101
-
102
-
103
-
104
-
105
-
106
-
107
-
108
-
109
-
110
-
111
-
112
-
113
-
114
-
115
-
116
-
117
-
118
-
119
-
120
-
121
-
122
-
123
-
124
-
125
-
126
-
127
-
128
-
129
-
130
-
131
-
132
-
133
-
134
-
135
-
136
-
137
-
138
-
139
-
140
-
141
-
142
-
143
-
144
-
145
-
146
-
147
-
148
-
149
-
150
-
151
-
152
-
153
-
154
-
155
-
156
-
157
-
158
-
159
-
160
-
161
-
162
-
163
-
164
-
165
-
166
-
167
-
168
-
169
-
170
-
171
-
172
-
173
-
174
-
175
-
176
-
177
-
178
-
179
-
180
 |
 |

48
Management’s Discussion and Analysis
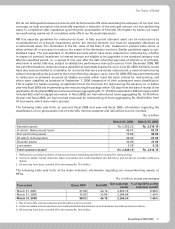
the same level as fiscal 2008. Increase in average interest-earning non-SLR investments was offset by decrease
in average SLR investments. Average SLR investments decreased by Rs. 23.51 billion primarily on account of
reduction in domestic net demand and time liabilities and a reduction of 100 basis points in SLR requirement
from 25.0% to 24.0% during fiscal 2009.
Yield on average interest-earning assets decreased by 31 basis points to 9.1% in fiscal 2009 compared to 9.4% in
fiscal 2008 primarily due to the decrease in the yield on advances by 91 basis points to 10.2% in fiscal 2009 from
11.1% in fiscal 2008, offset, in part, by reduction in CRR requirement. RBI reduced CRR by 250 basis points to
5.0% at year-end fiscal 2009 from 7.5% at year-end fiscal 2008. As CRR balances do not earn any interest income,
the reduction in requirement resulted in a positive impact on yield on interest-earning assets. Our overall yield on
advances decreased primarily on account of decrease in benchmark rate (LIBOR) and impact of rupee depreciation
on advances denominated in foreign currency. Yield on average interest-earning investments remained nearly at
the same level as fiscal 2008 (i.e. 7.6% for fiscal 2009 and 7.7% for fiscal 2008).
Interest income was also impacted by receipt of interest on income tax refund of Rs. 3.33 billion in fiscal 2009 as
compared to Rs. 0.87 billion in fiscal 2008 and loss on securitisation (including credit losses on existing pools) of
Rs. 3.21 billion in fiscal 2009. This impact was reflected over all the quarters of fiscal 2009.
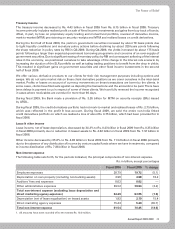
Interest expense decreased by 3.2% to Rs. 227.26 billion in fiscal 2009 from Rs. 234.84 billion in fiscal 2008 primarily
due to decrease in average deposits to Rs. 2,180.14 billion in fiscal 2009 from Rs. 2,268.13 billion in fiscal 2008
and decrease in cost of funds by 54 basis points to 7.0% in fiscal 2009 from 7.5% in fiscal 2008, offset, in part, by
increase in average borrowings to Rs. 1,069.03 billion in fiscal 2009 from Rs. 851.15 billion in fiscal 2008.
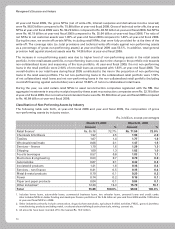
Total deposits decreased by 10.7% to Rs. 2,183.48 billion at year-end fiscal 2009 from Rs. 2,444.31 billion at year-
end fiscal 2008 primarily due to the Bank’s conscious strategy of paying off wholesale deposits. Term deposits
decreased to Rs. 1,556.80 billion at year-end fiscal 2009 from Rs. 1,806.51 billion at year-end fiscal 2008. The
proportion of current and savings account deposits in total deposits increased to 28.7% at year-end fiscal 2009
from 26.1% at year-end fiscal 2008. Borrowings in rupee terms have increased primarily due to new capital-
eligible borrowings, in the nature of subordinated debt and an impact of rupee depreciation on foreign currency
denominated borrowings. Borrowings (including subordinated debt) of foreign branches were US$ 10.88 billion
at year-end fiscal 2009 as compared to US$ 12.72 billion at year-end fiscal 2008.
Cost of funds has decreased to 7.0% in fiscal 2009 from 7.5% in fiscal 2008. Cost of deposits decreased by 30
basis points to 7.2% in fiscal 2009 from 7.5% in fiscal 2008. The cost of borrowings has decreased by 100 basis
points to 6.5% in fiscal 2009 from 7.5% in fiscal 2008. Cost of borrowings decreased primarily due to decrease
in cost of foreign currency borrowings as the benchmark rate (LIBOR) reduced, and also on account of impact
of rupee depreciation.
Net interest margin is expected to continue to be lower than other banks in India until we increase the proportion
of low-cost deposits and retail deposits in our total funding. The net interest margin is also impacted by the
relatively lower net interest margin earned by our overseas branches.
NON-INTEREST INCOME
Fee income
The first half of fiscal 2009 witnessed a robust growth in fee income primarily due to growth in fee income from
structuring and advisory fees, third party product distribution fees, income from foreign exchange transactions
and processing fees, in both domestic and international operations. Fee income in the second half of fiscal 2009
was impacted by slowdown in domestic economy and continued turmoil in international markets. Domestic
corporate activity slowed down considerably. This impacted the fee income from corporate and small and
medium enterprises. The high interest rates prevalent for a large part of the year combined with our strategy to
moderate balance sheet growth also impacted domestic lending activity with retail disbursements slowing down
considerably. This resulted in low retail asset related fees in fiscal 2009. Sales of third party products such as
insurance and mutual funds slowed down considerably in the second half of fiscal 2009 resulting in lower third
party distribution fees. As a result, fee income decreased by 1.6% to Rs. 65.24 billion in fiscal 2009 from Rs. 66.27
billion in fiscal 2008.