ICICI Bank 2009 Annual Report Download - page 107
Download and view the complete annual report
Please find page 107 of the 2009 ICICI Bank annual report below. You can navigate through the pages in the report by either clicking on the pages listed below, or by using the keyword search tool below to find specific information within the annual report.-
 1
1 -
2
-
3
-
4
-
5
-
6
-
7
-
8
-
9
-
10
-
11
-
12
-
13
-
14
-
15
-
16
-
17
-
18
-
19
-
20
-
21
-
22
-
23
-
24
-
25
-
26
-
27
-
28
-
29
-
30
-
31
-
32
-
33
-
34
-
35
-
36
-
37
-
38
-
39
-
40
-
41
-
42
-
43
-
44
-
45
-
46
-
47
-
48
-
49
-
50
-
51
-
52
-
53
-
54
-
55
-
56
-
57
-
58
-
59
-
60
-
61
-
62
-
63
-
64
-
65
-
66
-
67
-
68
-
69
-
70
-
71
-
72
-
73
-
74
-
75
-
76
-
77
-
78
-
79
-
80
-
81
-
82
-
83
-
84
-
85
-
86
-
87
-
88
-
89
-
90
-
91
-
92
-
93
-
94
-
95
-
96
-
 97
97 -
 98
98 -
 99
99 -
 100
100 -
 101
101 -
 102
102 -
 103
103 -
 104
104 -
 105
105 -
 106
106 -
 107
107 -
 108
108 -
 109
109 -
 110
110 -
 111
111 -
 112
112 -
 113
113 -
 114
114 -
 115
115 -
 116
116 -
 117
117 -
118
-
119
-
120
-
121
-
122
-
123
-
124
-
125
-
126
-
127
-
128
-
129
-
130
-
131
-
132
-
133
-
134
-
135
-
136
-
137
-
138
-
139
-
140
-
141
-
142
-
143
-
144
-
145
-
146
-
147
-
148
-
149
-
150
-
151
-
152
-
153
-
154
-
155
-
156
-
157
-
158
-
159
-
160
-
161
-
162
-
163
-
164
-
165
-
166
-
167
-
168
-
169
-
170
-
171
-
172
-
173
-
174
-
175
-
176
-
177
-
178
-
179
-
180
 |
 |

F33
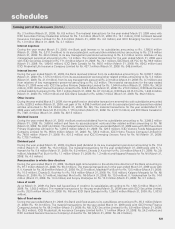
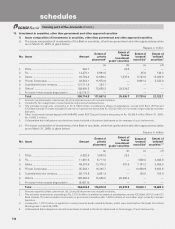
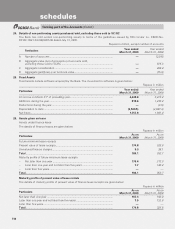
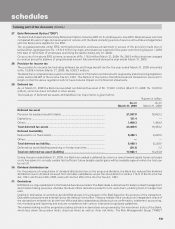
ii) Non-performing investments in securities, other than government and other approved securities
The movement in gross non-performing investments in securities, other than government and other approved securities
for the year ended March 31, 2009 and March 31, 2008 is given below:
Rupees in million
Particulars Year ended
March 31, 2009 Year ended
March 31, 2008
Opening balance ............................................................................................. 3,689.6 3,083.1
Additions during the year ................................................................................ 278.7 851.3
Reduction during the year ............................................................................... (139.2) (244.8)
Closing balance ............................................................................................... 3,829.1 3,689.6
Total provisions held ....................................................................................... 3,213.8 2,276.3
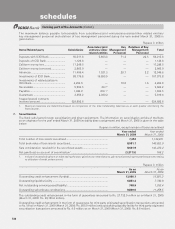
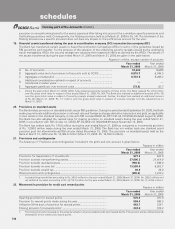
14. Repurchase transactions
The details of securities sold and purchased under repos and reverse repos during the year ended March 31, 2009 and
March 31, 2008 are given below:
Rupees in million
Minimum
outstanding
balance during
the year
Maximum
outstanding
balance during
the year
Daily average
outstanding
balance during
the year
Balance as on
year end
Year ended March 31, 2009
Securities sold under repurchase transaction ...... — 145,875.0 66,861.3 22,092.3
Securities purchased under reverse repurchase
transaction ............................................................ — 10,499.7 31.5 —
Year ended March 31, 2008
Securities sold under repurchase transaction ...... — 101,463.6 34,644.5 24,496.8
Securities purchased under reverse repurchase
transaction ............................................................ — 23,044.2 1,330.2 —
1. The above figures do not include securities sold and purchased under Liquidity Adjustment Facility (“LAF”) of RBI.
2. The above figures are for Indian branches only.
3. Minimum, maximum & average outstanding is based on first leg of transaction & balance outstanding is based on book value.
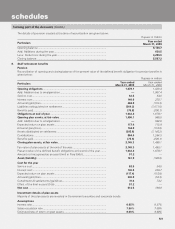
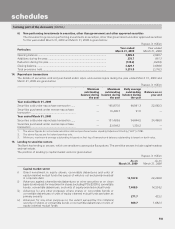
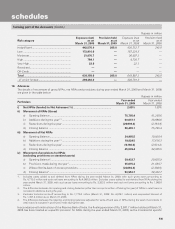
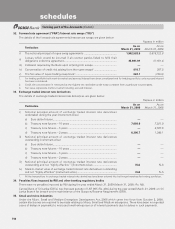
15. Lending to sensitive sectors
The Bank has lending to sectors, which are sensitive to asset price fluctuations. The sensitive sectors include capital markets
and real estate.
The position of lending to capital market sector is given below:
Rupees in million
As on
March 31, 2009 As on
March 31, 2008
Capital market sector
i) Direct investment in equity shares, convertible debentures and units of
equity-oriented mutual funds the corpus of which is not exclusively invested
in corporate debt 13,167.9 29,240.6
ii) Advances against shares/bonds/debentures or other securities or on clean
basis to individuals for investment in shares (including IPOs/ESOPs), convertible
bonds, convertible debentures, and units of equity-oriented mutual funds 7,408.5 14,324.2
iii) Advances for any other purposes where shares or convertible bonds or
convertible debentures or units of equity oriented mutual funds are taken as
primary security 271.7 423.2
iv) Advances for any other purposes to the extent secured by the collateral
security of shares or convertible bonds or convertible debentures or units of
equity oriented mutual funds 609.7 1,692.3
forming part of the Accounts (Contd.)
schedules