ICICI Bank 2009 Annual Report Download - page 51
Download and view the complete annual report
Please find page 51 of the 2009 ICICI Bank annual report below. You can navigate through the pages in the report by either clicking on the pages listed below, or by using the keyword search tool below to find specific information within the annual report.-
 1
1 -
2
-
3
-
4
-
5
-
6
-
7
-
8
-
9
-
10
-
11
-
12
-
13
-
14
-
15
-
16
-
17
-
18
-
19
-
20
-
21
-
22
-
23
-
24
-
25
-
26
-
27
-
28
-
29
-
30
-
31
-
32
-
33
-
34
-
35
-
36
-
37
-
38
-
39
-
40
-
 41
41 -
 42
42 -
 43
43 -
 44
44 -
 45
45 -
 46
46 -
 47
47 -
 48
48 -
 49
49 -
 50
50 -
 51
51 -
 52
52 -
 53
53 -
 54
54 -
 55
55 -
 56
56 -
 57
57 -
 58
58 -
 59
59 -
 60
60 -
 61
61 -
62
-
63
-
64
-
65
-
66
-
67
-
68
-
69
-
70
-
71
-
72
-
73
-
74
-
75
-
76
-
77
-
78
-
79
-
80
-
81
-
82
-
83
-
84
-
85
-
86
-
87
-
88
-
89
-
90
-
91
-
92
-
93
-
94
-
95
-
96
-
97
-
98
-
99
-
100
-
101
-
102
-
103
-
104
-
105
-
106
-
107
-
108
-
109
-
110
-
111
-
112
-
113
-
114
-
115
-
116
-
117
-
118
-
119
-
120
-
121
-
122
-
123
-
124
-
125
-
126
-
127
-
128
-
129
-
130
-
131
-
132
-
133
-
134
-
135
-
136
-
137
-
138
-
139
-
140
-
141
-
142
-
143
-
144
-
145
-
146
-
147
-
148
-
149
-
150
-
151
-
152
-
153
-
154
-
155
-
156
-
157
-
158
-
159
-
160
-
161
-
162
-
163
-
164
-
165
-
166
-
167
-
168
-
169
-
170
-
171
-
172
-
173
-
174
-
175
-
176
-
177
-
178
-
179
-
180
 |
 |

49Annual Report 2008-2009
The Power of Belief
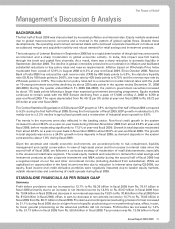
Treasury income
The treasury income decreased to Rs. 4.43 billion in fiscal 2009 from Rs. 8.15 billion in fiscal 2008. Treasury
income primarily includes realised profit on sale of fixed income investments and gains from buy-back of bonds,
offset, in part, by loss on proprietary equity trading and mutual fund portfolio, reversal of derivative income,
mark-to-market (MTM) provisioning on security receipts and MTM and realised losses on credit derivatives.
During the first half of fiscal 2009, the yield on government securities increased by about 70 basis points due
to tight liquidity conditions and monetary policy actions before declining by about 320 basis points following
the sharp reduction in policy rates by RBI in Q3-2009. During Q4-2009, the yields increased by about 175 basis
points following a larger than expected government borrowing programme and concerns of an over-supply of
government securities. Due to significant easing of monetary policy by RBI and consequent softening of the interest
rates in the economy, we positioned ourselves to take advantage of the change in the interest rate scenario by
increasing the duration of the SLR portfolio as well as taking trading positions to benefit from the drop in yields.
This resulted in significant gains on government securities and other fixed income investments in the second
half of fiscal 2009.
We offer various derivative products to our clients for their risk management purposes including options and
swaps. We do not carry market risk on these client derivative positions as we cover ourselves in the inter-bank
market. Profits or losses on account of currency movements on these transactions are borne by the clients. In
some cases, clients have filed suits against us disputing the transactions and the amounts to be paid. There have
been delays in payment to us in respect of some of these clients. We have fully reversed the income recognised
in cases where receivables are overdue for more than 90 days.
During fiscal 2009, the Bank made a provision of Rs. 3.26 billion for MTM on security receipts (SRs) issued
by ARCIL.
During fiscal 2009, the credit derivatives portfolio had net mark-to-market and realised losses of Rs. 2.75 billion,
which was reflected in the profit & loss account. During fiscal 2009, we sold the entire non-India linked
credit derivatives portfolio on which we realised a loss of about Rs. 4.75 billion, which had been provided for in
fiscal 2008.
Lease & other income
Lease income, net of lease depreciation, decreased by 34.3% to Rs. 0.23 billion in fiscal 2009 from Rs. 0.35 billion
in fiscal 2008 primarily due to reduction in leased assets to Rs. 4.62 billion in fiscal 2009 from Rs. 7.97 billion in
fiscal 2008.
Other income decreased by 65.0% to Rs. 4.03 billion in fiscal 2009 from Rs. 11.52 billion in fiscal 2008 primarily
due to the absence of any distribution of income by venture capital funds where we have investments, compared
to income distribution of Rs. 7.88 billion in fiscal 2008.
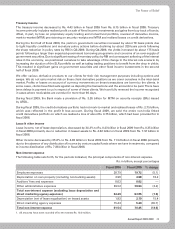
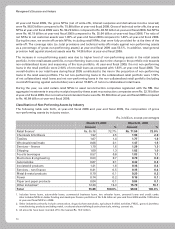
Non-interest expense
The following table sets forth, for the periods indicated, the principal components of non-interest expense.
Rs. in billion, except percentages
Fiscal 2008 Fiscal 2009 % change
Employee expenses 20.79 19.72 (5.1)
Depreciation on own property (including non banking assets) 3.96 4.68 18.2
Auditors’ fees and expenses 0.02 0.02 —
Other administrative expenses 39.52 38.64 (2.2)
Total non-interest expense (excluding lease depreciation and
direct marketing agency expenses) 64.29 63.06 (1.9)
Depreciation (net of lease equalisation) on leased assets 1.82 2.10 15.4
Direct marketing agency expenses 15.43 5.29 (65.7)
Total non-interest expense 81.54 70.45 (13.6)
1. All amounts have been rounded off to the nearest Rs. 10.0 million.