ICICI Bank 2009 Annual Report Download - page 53
Download and view the complete annual report
Please find page 53 of the 2009 ICICI Bank annual report below. You can navigate through the pages in the report by either clicking on the pages listed below, or by using the keyword search tool below to find specific information within the annual report.-
 1
1 -
2
-
3
-
4
-
5
-
6
-
7
-
8
-
9
-
10
-
11
-
12
-
13
-
14
-
15
-
16
-
17
-
18
-
19
-
20
-
21
-
22
-
23
-
24
-
25
-
26
-
27
-
28
-
29
-
30
-
31
-
32
-
33
-
34
-
35
-
36
-
37
-
38
-
39
-
40
-
41
-
42
-
 43
43 -
 44
44 -
 45
45 -
 46
46 -
 47
47 -
 48
48 -
 49
49 -
 50
50 -
 51
51 -
 52
52 -
 53
53 -
 54
54 -
 55
55 -
 56
56 -
 57
57 -
 58
58 -
 59
59 -
 60
60 -
 61
61 -
 62
62 -
 63
63 -
64
-
65
-
66
-
67
-
68
-
69
-
70
-
71
-
72
-
73
-
74
-
75
-
76
-
77
-
78
-
79
-
80
-
81
-
82
-
83
-
84
-
85
-
86
-
87
-
88
-
89
-
90
-
91
-
92
-
93
-
94
-
95
-
96
-
97
-
98
-
99
-
100
-
101
-
102
-
103
-
104
-
105
-
106
-
107
-
108
-
109
-
110
-
111
-
112
-
113
-
114
-
115
-
116
-
117
-
118
-
119
-
120
-
121
-
122
-
123
-
124
-
125
-
126
-
127
-
128
-
129
-
130
-
131
-
132
-
133
-
134
-
135
-
136
-
137
-
138
-
139
-
140
-
141
-
142
-
143
-
144
-
145
-
146
-
147
-
148
-
149
-
150
-
151
-
152
-
153
-
154
-
155
-
156
-
157
-
158
-
159
-
160
-
161
-
162
-
163
-
164
-
165
-
166
-
167
-
168
-
169
-
170
-
171
-
172
-
173
-
174
-
175
-
176
-
177
-
178
-
179
-
180
 |
 |

51Annual Report 2008-2009
The Power of Belief
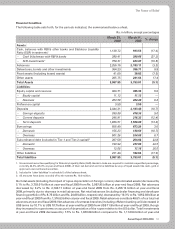
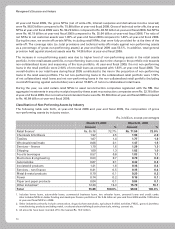
Financial Condition
The following table sets forth, for the periods indicated, the summarised balance sheet.
Rs. in billion, except percentages
March 31,
2008 March 31,
2009 % change
Assets:
Cash, balances with RBI & other banks and Statutory Liquidity
Ratio (SLR) investments11,130.72 933.53 (17.4)
– Cash & balances with RBI & banks 380.41 299.66 (21.2)
– SLR investments1750.31 633.87 (15.5)
Advances 2,256.16 2,183.11 (3.2)
Debentures, bonds and other investments 364.23 396.71 8.9
Fixed assets (including leased assets) 41.09 38.02 (7.5)
Other assets 205.75 241.64 17.4
Total Assets 3,997.95 3,793.01 (5.1)
Liabilities:
Equity capital and reserves 464.71 495.33 6.6
– Equity capital 11.13 11.13 —
– Reserves 453.58 484.20 6.8
Preference capital 3.50 3.50 —
Deposits 2,444.31 2,183.48 (10.7)
– Savings deposits 390.89 410.36 5.0
– Current deposits 246.91 216.32 (12.4)
– Term deposits 1,806.51 1,556.80 (13.8)
Borrowings 656.49 673.24 2.6
– Domestic 155.23 138.56 (10.7)
– Overseas 501.26 534.68 6.7
Subordinated debt (included in Tier-1 and Tier-2 capital)2207.50 254.82 22.8
– Domestic 193.94 237.66 22.5
– Overseas 13.56 17.16 26.5
Other liabilities 221.44 182.64 (17.5)
Total liabilities 3,997.95 3,793.01 (5.1)
1. Government securities qualifying for Statutory Liquidity Ratio (SLR). Banks in India are required to maintain a specified percentage,
currently 24.0% (25.0% at year-end fiscal 2008), of their net demand and time liabilities by way of liquid assets like cash, gold or
approved unencumbered securities.
2. Included in ‘other liabilities’ in schedule 5 of the balance sheet.
3. All amounts have been rounded off to the nearest Rs. 10.0 million.
Our total assets (including the impact of rupee depreciation on foreign currency denominated assets) decreased by
5.1% to Rs. 3,793.01 billion at year-end fiscal 2009 from Rs. 3,997.95 billion at year-end fiscal 2008. Net advances
decreased by 3.2% to Rs. 2,183.11 billion at year-end fiscal 2009 from Rs. 2,256.16 billion at year-end fiscal
2008, primarily due to decrease in retail advances. Net retail advances (including dealer financing and developer
financing portfolio of Rs. 8.75 billion and Rs. 24.08 billion, respectively) decreased by 19.3% to Rs. 1,062.03 billion at
year-end fiscal 2009 from Rs. 1,316.63 billion at year-end fiscal 2008. Retail advances constitute 48.6% of our total net
advances at year-end fiscal 2009. Net advances of overseas branches (including offshore banking unit) decreased in
US$ terms by 10.1% to US$ 10.7 billion at year-end fiscal 2009 from US$ 11.9 billion at year-end fiscal 2008, though
they increased in rupee terms on account of depreciation of the rupee relative to the US dollar. Total investments
at year-end fiscal 2009 decreased by 7.5% to Rs. 1,030.58 billion compared to Rs. 1,114.54 billion at year-end