ICICI Bank 2009 Annual Report Download - page 129
Download and view the complete annual report
Please find page 129 of the 2009 ICICI Bank annual report below. You can navigate through the pages in the report by either clicking on the pages listed below, or by using the keyword search tool below to find specific information within the annual report.-
 1
1 -
2
-
3
-
4
-
5
-
6
-
7
-
8
-
9
-
10
-
11
-
12
-
13
-
14
-
15
-
16
-
17
-
18
-
19
-
20
-
21
-
22
-
23
-
24
-
25
-
26
-
27
-
28
-
29
-
30
-
31
-
32
-
33
-
34
-
35
-
36
-
37
-
38
-
39
-
40
-
41
-
42
-
43
-
44
-
45
-
46
-
47
-
48
-
49
-
50
-
51
-
52
-
53
-
54
-
55
-
56
-
57
-
58
-
59
-
60
-
61
-
62
-
63
-
64
-
65
-
66
-
67
-
68
-
69
-
70
-
71
-
72
-
73
-
74
-
75
-
76
-
77
-
78
-
79
-
80
-
81
-
82
-
83
-
84
-
85
-
86
-
87
-
88
-
89
-
90
-
91
-
92
-
93
-
94
-
95
-
96
-
97
-
98
-
99
-
100
-
101
-
102
-
103
-
104
-
105
-
106
-
107
-
108
-
109
-
110
-
111
-
112
-
113
-
114
-
115
-
116
-
117
-
118
-
 119
119 -
 120
120 -
 121
121 -
 122
122 -
 123
123 -
 124
124 -
 125
125 -
 126
126 -
 127
127 -
 128
128 -
 129
129 -
 130
130 -
 131
131 -
 132
132 -
 133
133 -
 134
134 -
 135
135 -
 136
136 -
 137
137 -
 138
138 -
 139
139 -
140
-
141
-
142
-
143
-
144
-
145
-
146
-
147
-
148
-
149
-
150
-
151
-
152
-
153
-
154
-
155
-
156
-
157
-
158
-
159
-
160
-
161
-
162
-
163
-
164
-
165
-
166
-
167
-
168
-
169
-
170
-
171
-
172
-
173
-
174
-
175
-
176
-
177
-
178
-
179
-
180
 |
 |

F55
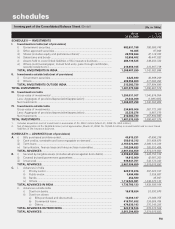
schedules
(Rs. in ‘000s)
forming part of the Consolidated Balance Sheet (Contd.)
As on
31.03.2009 As on
31.03.2008
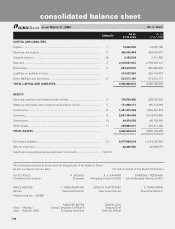
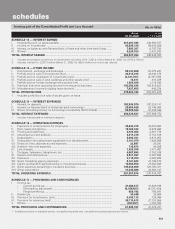
SCHEDULE 8 — INVESTMENTS
I. Investments in India (net of provisions)
i) Government securities .................................................................................... 682,931,198 786,560,746
ii) Other approved securities............................................................................... 93,405 97,946
iii) Shares (includes equity and preference shares)1 ........................................... 29,708,664 47,118,726
iv) Debentures and bonds ................................................................................... 52,956,402 49,447,032
v) Assets held to cover linked liabilities of life insurance business ................... 286,139,525 248,450,720
vi) Others (commercial paper, mutual fund units, pass through certificates,
security receipts etc.) ...................................................................................... 216,658,105 210,887,719
TOTAL INVESTMENTS IN INDIA .......................................................................... 1,268,487,299 1,342,562,889
II. Investments outside India (net of provisions)
i) Government securities .................................................................................... 4,525,830 40,899,298
ii) Others .............................................................................................................. 208,056,900 217,005,392
TOTAL INVESTMENTS OUTSIDE INDIA .............................................................. 212,582,730 257,904,690
TOTAL INVESTMENTS .................................................................................................. 1,481,070,029 1,600,467,579
III. Investments in India
Gross value of investments2 ................................................................................... 1,290,031,307 1,340,676,954
Less: Aggregate of provision/depreciation/(appreciation) .................................... 21,544,008 (1,885,935)
Net investments ...................................................................................................... 1,268,487,299 1,342,562,889
IV. Investments outside India
Gross value of investments .................................................................................... 234,903,006 267,772,200
Less: Aggregate of provision/depreciation/(appreciation) ..................................... 22,320,276 9,867,510
Net investments ..................................................................................................... 212,582,730 257,904,690
TOTAL INVESTMENTS .................................................................................................. 1,481,070,029 1,600,467,579
1. Includes acquisition cost of investment in associates of Rs. 459.2 million (March 31, 2008: Rs. 95.4 million).
2. Net of depreciation of Rs. 36,369.6 milion (net of appreciation, March 31, 2008: Rs. 19,534.4 million) on investments held to cover linked
liabilities of life insurance business.
SCHEDULE 9 — ADVANCES (net of provisions)
A. i) Bills purchased and discounted ...................................................................... 40,915,231 47,896,278
ii) Cash credits, overdrafts and loans repayable on demand ............................. 350,610,312 351,458,670
iii) Term loans....................................................................................................... 2,167,574,693 2,009,110,336
iv) Securitisation, finance lease and hire purchase receivables .......................... 102,204,423 105,551,409
TOTAL ADVANCES ................................................................................................ 2,661,304,659 2,514,016,693
B. i) Secured by tangible assets (includes advances against book debts) ............ 2,009,647,889 1,928,756,159
ii) Covered by bank/government guarantees ...................................................... 14,815,009 42,087,202
iii) Unsecured ....................................................................................................... 636,841,761 543,173,332
TOTAL ADVANCES ................................................................................................ 2,661,304,659 2,514,016,693
C. I. Advances in India
i) Priority sector .......................................................................................... 620,515,976 597,325,197
ii) Public sector ............................................................................................ 3,494,486 3,559,887
iii) Banks ....................................................................................................... 252,580 45,947
iv) Others ...................................................................................................... 1,112,523,081 1,238,575,133
TOTAL ADVANCES IN INDIA ................................................................................ 1,736,786,123 1,839,506,164
II. Advances outside India
i) Due from banks ....................................................................................... 16,618,624 53,593,670
ii) Due from others
a) Bills purchased and discounted
...................................................... 14,069,137 21,006,755
b) Commercial loans............................................................................ 419,791,632 324,669,709
c) Others .............................................................................................. 474,039,143 275,240,395
TOTAL ADVANCES OUTSIDE INDIA .................................................................... 924,518,536 674,510,529
TOTAL ADVANCES ................................................................................................ 2,661,304,659 2,514,016,693