ICICI Bank 2009 Annual Report Download - page 145
Download and view the complete annual report
Please find page 145 of the 2009 ICICI Bank annual report below. You can navigate through the pages in the report by either clicking on the pages listed below, or by using the keyword search tool below to find specific information within the annual report.-
 1
1 -
2
-
3
-
4
-
5
-
6
-
7
-
8
-
9
-
10
-
11
-
12
-
13
-
14
-
15
-
16
-
17
-
18
-
19
-
20
-
21
-
22
-
23
-
24
-
25
-
26
-
27
-
28
-
29
-
30
-
31
-
32
-
33
-
34
-
35
-
36
-
37
-
38
-
39
-
40
-
41
-
42
-
43
-
44
-
45
-
46
-
47
-
48
-
49
-
50
-
51
-
52
-
53
-
54
-
55
-
56
-
57
-
58
-
59
-
60
-
61
-
62
-
63
-
64
-
65
-
66
-
67
-
68
-
69
-
70
-
71
-
72
-
73
-
74
-
75
-
76
-
77
-
78
-
79
-
80
-
81
-
82
-
83
-
84
-
85
-
86
-
87
-
88
-
89
-
90
-
91
-
92
-
93
-
94
-
95
-
96
-
97
-
98
-
99
-
100
-
101
-
102
-
103
-
104
-
105
-
106
-
107
-
108
-
109
-
110
-
111
-
112
-
113
-
114
-
115
-
116
-
117
-
118
-
119
-
120
-
121
-
122
-
123
-
124
-
125
-
126
-
127
-
128
-
129
-
130
-
131
-
132
-
133
-
134
-
 135
135 -
 136
136 -
 137
137 -
 138
138 -
 139
139 -
 140
140 -
 141
141 -
 142
142 -
 143
143 -
 144
144 -
 145
145 -
 146
146 -
 147
147 -
 148
148 -
 149
149 -
 150
150 -
 151
151 -
 152
152 -
 153
153 -
 154
154 -
 155
155 -
156
-
157
-
158
-
159
-
160
-
161
-
162
-
163
-
164
-
165
-
166
-
167
-
168
-
169
-
170
-
171
-
172
-
173
-
174
-
175
-
176
-
177
-
178
-
179
-
180
 |
 |

F71
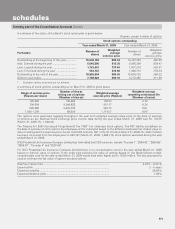
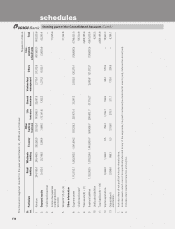
A summary of the status of the Bank’s stock option plan is given below. Rupees, except number of options
Stock options outstanding
Year ended March 31, 2009 Year ended March 31, 2008
Particulars Number of
shares
Weighted
average
exercise price
Number of
shares
Weighted
average
exercise price
Outstanding at the beginning of the year ............... 15,638,152 596.32 13,187,783 442.50
Add: Granted during the year ................................. 5,640,500 912.30 4,956,300 938.41
Less: Lapsed during the year ................................. 1,723,001 737.40 1,037,218 582.51
Less: Exercised during the year1 ........................... 563,147 336.96 1,468,713 379.34
Outstanding at the end of the year ......................... 18,992,504 685.05 15,638,152 596.32
Options exercisable ................................................ 7,188,420 496.10 3,272,292 411.89
1. Excludes options exercised but not allotted.
A summary of stock options outstanding as on March 31, 2009 is given below.
Range of exercise price
(Rupees per share)
Number of shares
arising out of options
(Number of shares)
Weighted average
exercise price (Rupees)
Weighted average
remaining contractual life
(Number of years)
105-299 136,682 150.53 2.79
300-599 9,384,822 451.17 6.34
600-999 9,403,000 923.15 8.61
1,000-1,399 68,000 1,114.57 8.65
The options were exercised regularly throughout the year and weighted average share price at the date of exercise
of options as per National Stock Exchange price volume data during the year ended March 31, 2009 was Rs. 723.55
(March 31, 2008: Rs. 1,044.02).
The Finance Act 2007 introduced Fringe Benefit Tax (“FBT”) on employee stock options. The FBT liability crystallises on
the date of exercise of stock options by employees and is computed based on the difference between fair market value on
date of vesting and the exercise price. As per the ESOS scheme, FBT of Rs. 81.9 million (March 31, 2008: Rs. 226.7 million)
has been recovered from the employees on 563,147 (March 31, 2008: 1,468,713) stock options exercised during the year
ended March 31, 2009.
ICICI Prudential Life Insurance Company Limited has formulated six ESOS schemes, namely “Founder I”, “2004-05”, “2005-06”,
”2006-07”, “Founder II” and “2007-08“.
For ICICI Prudential Life Insurance Company Limited there is no compensation cost for the year ended March 31, 2009
based on intrinsic value of options. If the entity had used the fair value of options based on the Black-Scholes model,
compensation cost for the year ended March 31, 2009 would have been higher by Rs. 359.0 million. The key assumptions
used to estimate the fair value of options are given below.
Risk-free interest rate .......................................................................................... 6.87% – 8.00 %
Expected life ....................................................................................................... 3 – 5 years
Expected volatility ............................................................................................... 28.65%
Expected dividend yield ...................................................................................... 1.50%
forming part of the Consolidated Accounts (Contd.)
schedules