ICICI Bank 2009 Annual Report Download - page 60
Download and view the complete annual report
Please find page 60 of the 2009 ICICI Bank annual report below. You can navigate through the pages in the report by either clicking on the pages listed below, or by using the keyword search tool below to find specific information within the annual report.-
 1
1 -
2
-
3
-
4
-
5
-
6
-
7
-
8
-
9
-
10
-
11
-
12
-
13
-
14
-
15
-
16
-
17
-
18
-
19
-
20
-
21
-
22
-
23
-
24
-
25
-
26
-
27
-
28
-
29
-
30
-
31
-
32
-
33
-
34
-
35
-
36
-
37
-
38
-
39
-
40
-
41
-
42
-
43
-
44
-
45
-
46
-
47
-
48
-
49
-
 50
50 -
 51
51 -
 52
52 -
 53
53 -
 54
54 -
 55
55 -
 56
56 -
 57
57 -
 58
58 -
 59
59 -
 60
60 -
 61
61 -
 62
62 -
 63
63 -
 64
64 -
 65
65 -
 66
66 -
 67
67 -
 68
68 -
 69
69 -
 70
70 -
71
-
72
-
73
-
74
-
75
-
76
-
77
-
78
-
79
-
80
-
81
-
82
-
83
-
84
-
85
-
86
-
87
-
88
-
89
-
90
-
91
-
92
-
93
-
94
-
95
-
96
-
97
-
98
-
99
-
100
-
101
-
102
-
103
-
104
-
105
-
106
-
107
-
108
-
109
-
110
-
111
-
112
-
113
-
114
-
115
-
116
-
117
-
118
-
119
-
120
-
121
-
122
-
123
-
124
-
125
-
126
-
127
-
128
-
129
-
130
-
131
-
132
-
133
-
134
-
135
-
136
-
137
-
138
-
139
-
140
-
141
-
142
-
143
-
144
-
145
-
146
-
147
-
148
-
149
-
150
-
151
-
152
-
153
-
154
-
155
-
156
-
157
-
158
-
159
-
160
-
161
-
162
-
163
-
164
-
165
-
166
-
167
-
168
-
169
-
170
-
171
-
172
-
173
-
174
-
175
-
176
-
177
-
178
-
179
-
180
 |
 |

58
Management’s Discussion and Analysis
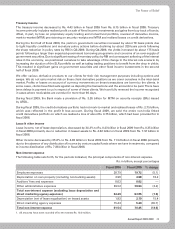
At year-end fiscal 2009, the gross NPAs (net of write-offs, interest suspense and derivatives income reversal)
were Rs. 98.03 billion compared to Rs. 75.88 billion at year-end fiscal 2008. Gross of technical write-offs, the gross
NPAs at year-end fiscal 2009 were Rs. 99.29 billon compared to Rs. 83.50 billion at year-end fiscal 2008. Net NPAs
were Rs. 46.19 billion at year-end fiscal 2009 compared to Rs. 35.64 billion at year-end fiscal 2008. The ratio of
net NPAs to net customer assets was 1.96% at year-end fiscal 2009 compared to 1.49% at year-end fiscal 2008.
During the year, we wrote-off certain NPAs, including retail NPAs, that were fully provided for at the time of the
write-off. The coverage ratio (i.e. total provisions and technical write-offs made against non-performing assets
as a percentage of gross non-performing assets) at year-end fiscal 2009 was 53.5%. In addition, total general
provision held against standard assets was Rs. 14.36 billion at year-end fiscal 2009.
The increase in non-performing assets was due to higher level of non-performing assets in the retail assets
portfolio. In the retail assets portfolio, non-performing loans rose due to the change in the portfolio mix towards
non-collateralised loans and seasoning of the loan portfolio. At year-end fiscal 2009, the net non-performing
loans in the retail portfolio were 2.94% of net retail loans as compared with 1.83% at year-end fiscal 2008. The
overall decline in our retail loans during fiscal 2009 contributed to the rise in the proportion of non-performing
loans in the retail asset portfolio. The net non-performing loans in the collateralised retail portfolio were 1.59%
of net collateralised retail loans and net non-performing loans in the non-collateralised retail portfolio (including
overdraft financing against automobiles) were about 10.08% of net non-collateralised retail loans.
During the year, we sold certain retail NPAs to asset reconstruction companies registered with the RBI. Our
aggregate investments in security receipts issued by these asset reconstruction companies were Rs. 32.18 billion
at year-end fiscal 2009. Our net restructured standard loans were Rs. 59.38 billion at year-end fiscal 2009 compared
to Rs. 46.84 billion at year-end fiscal 2008.
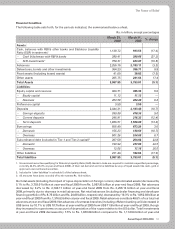
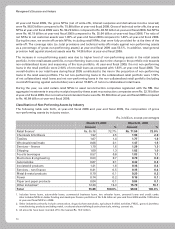
Classification of Non-Performing Assets by Industry
The following table sets forth, at year-end fiscal 2008 and year-end fiscal 2009, the composition of gross
non-performing assets by industry sector.
Rs. in billion, except percentages
March 31, 2008 March 31, 2009
Amount % Amount %
Retail finance1Rs. 55.16 72.7% Rs. 71.50 72.9%
Chemicals & fertilisers 1.92 2.5 1.96 2.0
Textiles 1.07 1.4 1.77 1.8
Wholesale/retail trade 0.08 0.1 1.47 1.5
Services – finance 1.19 1.6 1.29 1.3
Shipping 1.00 1.3 1.02 1.0
Food & beverages 0.57 0.8 1.03 1.1
Electronics & engineering 0.53 0.7 0.79 0.8
Automobiles 0.07 0.1 0.32 0.3
Iron/steel & products 1.21 1.6 0.36 0.4
Services – non finance 0.41 0.5 0.35 0.4
Metal & metal products 0.10 0.1 0.20 0.2
Power 0.14 0.2 0.15 0.1
Paper and paper products 0.04 0.1 0.04 0.1
Other industries212.39 16.3 15.78 16.1
Total 75.88 100.0% 98.03 100.0%
1. Includes home loans, automobile loans, commercial business loans, two wheeler loans, personal loans and credit cards.
Also includes NPAs in dealer funding and developer finance portfolios of Rs. 0.44 billion at year-end fiscal 2009 and Rs. 0.30 billion
at year-end fiscal NPA’s in 2008.
2. Other industries primarily include construction, drugs & pharmaceuticals, agriculture & allied activities, FMCG, gems & jewellery,
manufacturing products excluding metal, crude petroleum/refining & petrochemicals, mining, cement etc.
3. All amounts have been rounded off to the nearest Rs. 10.0 million.