ICICI Bank 2009 Annual Report Download - page 173
Download and view the complete annual report
Please find page 173 of the 2009 ICICI Bank annual report below. You can navigate through the pages in the report by either clicking on the pages listed below, or by using the keyword search tool below to find specific information within the annual report.-
 1
1 -
2
-
3
-
4
-
5
-
6
-
7
-
8
-
9
-
10
-
11
-
12
-
13
-
14
-
15
-
16
-
17
-
18
-
19
-
20
-
21
-
22
-
23
-
24
-
25
-
26
-
27
-
28
-
29
-
30
-
31
-
32
-
33
-
34
-
35
-
36
-
37
-
38
-
39
-
40
-
41
-
42
-
43
-
44
-
45
-
46
-
47
-
48
-
49
-
50
-
51
-
52
-
53
-
54
-
55
-
56
-
57
-
58
-
59
-
60
-
61
-
62
-
63
-
64
-
65
-
66
-
67
-
68
-
69
-
70
-
71
-
72
-
73
-
74
-
75
-
76
-
77
-
78
-
79
-
80
-
81
-
82
-
83
-
84
-
85
-
86
-
87
-
88
-
89
-
90
-
91
-
92
-
93
-
94
-
95
-
96
-
97
-
98
-
99
-
100
-
101
-
102
-
103
-
104
-
105
-
106
-
107
-
108
-
109
-
110
-
111
-
112
-
113
-
114
-
115
-
116
-
117
-
118
-
119
-
120
-
121
-
122
-
123
-
124
-
125
-
126
-
127
-
128
-
129
-
130
-
131
-
132
-
133
-
134
-
135
-
136
-
137
-
138
-
139
-
140
-
141
-
142
-
143
-
144
-
145
-
146
-
147
-
148
-
149
-
150
-
151
-
152
-
153
-
154
-
155
-
156
-
157
-
158
-
159
-
160
-
161
-
162
-
 163
163 -
 164
164 -
 165
165 -
 166
166 -
 167
167 -
 168
168 -
 169
169 -
 170
170 -
 171
171 -
 172
172 -
 173
173 -
 174
174 -
 175
175 -
 176
176 -
 177
177 -
 178
178 -
 179
179 -
 180
180
 |
 |

F99
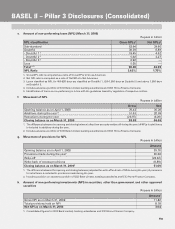
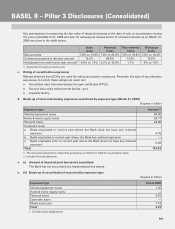
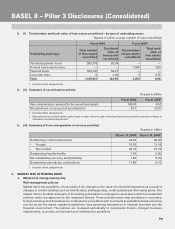
h. (i) Total number and book value of loan assets securitised – by type of underlying assets
Rupees in billion, except number of loans securitised
Fiscal 2008 Fiscal 20091
Underlying asset type
Total number
of loan assets
securitized
Total book
value of
loan assets
securitised
Total number
of loan assets
securitized
Total book
value of
loan assets
securitized
Vehicle/equipment loans 585,779 83.34 — —
Home & home equity loans — — 7,050 3.83
Personal loans 564,147 54.21 — —
Corporate loans 5 3.30 3 4.75
Total 1,149,931 140.85 7,053 8.58
1. Includes direct assignments.
h. (ii) Summary of securitisation activity
Rupees in billion
Fiscal 2008 Fiscal 20091
Sale consideration received for the securitised assets 142.47 8.62
Net gain/(loss) on account of securitisation20.17 (3.21)
1. Includes direct assignments.
2. Represents loss booked upfront, gain/(loss) on deal closures, gain amortised during the period & expenses relating to
utilisation of credit enhancement.
h. (iii) Summary of form and quantum of services provided
Rupees in billion
March 31, 2008 March 31, 20091
Outstanding credit enhancement 44.86 40.92
– Funded 15.70 13.19
– Non-funded 29.16 27.73
Outstanding liquidity facility 7.74 6.85
Net outstanding servicing asset/(liability) 1.36 0.75
Outstanding subordinate contributions 11.80 9.15
1. Includes direct assignments.
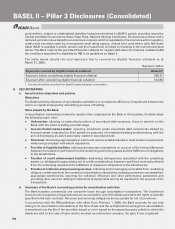
9. MARKET RISK IN TRADING BOOK
a. Market risk management policy
Risk management policies
Market risk is the possibility of loss arising from changes in the value of a financial instrument as a result of
changes in market variables such as interest rates, exchange rates, credit spreads and other asset prices. The
market risk for the Bank and each of its banking subsidiaries is managed in accordance with the investment
policies, which are approved by the respective Boards. These policies ensure that operations in securities,
foreign exchange and derivatives are conducted in accordance with sound and acceptable business practices
and are as per the extant regulatory guidelines, laws governing transactions in financial securities and the
financial environment. The policies are reviewed periodically to incorporate therein, changed business
requirements, economic environment and revised policy guidelines.
BASEL II – Pillar 3 Disclosures (Consolidated)