ICICI Bank 2009 Annual Report Download - page 100
Download and view the complete annual report
Please find page 100 of the 2009 ICICI Bank annual report below. You can navigate through the pages in the report by either clicking on the pages listed below, or by using the keyword search tool below to find specific information within the annual report.-
 1
1 -
2
-
3
-
4
-
5
-
6
-
7
-
8
-
9
-
10
-
11
-
12
-
13
-
14
-
15
-
16
-
17
-
18
-
19
-
20
-
21
-
22
-
23
-
24
-
25
-
26
-
27
-
28
-
29
-
30
-
31
-
32
-
33
-
34
-
35
-
36
-
37
-
38
-
39
-
40
-
41
-
42
-
43
-
44
-
45
-
46
-
47
-
48
-
49
-
50
-
51
-
52
-
53
-
54
-
55
-
56
-
57
-
58
-
59
-
60
-
61
-
62
-
63
-
64
-
65
-
66
-
67
-
68
-
69
-
70
-
71
-
72
-
73
-
74
-
75
-
76
-
77
-
78
-
79
-
80
-
81
-
82
-
83
-
84
-
85
-
86
-
87
-
88
-
89
-
 90
90 -
 91
91 -
 92
92 -
 93
93 -
 94
94 -
 95
95 -
 96
96 -
 97
97 -
 98
98 -
 99
99 -
 100
100 -
 101
101 -
 102
102 -
 103
103 -
 104
104 -
 105
105 -
 106
106 -
 107
107 -
 108
108 -
 109
109 -
 110
110 -
111
-
112
-
113
-
114
-
115
-
116
-
117
-
118
-
119
-
120
-
121
-
122
-
123
-
124
-
125
-
126
-
127
-
128
-
129
-
130
-
131
-
132
-
133
-
134
-
135
-
136
-
137
-
138
-
139
-
140
-
141
-
142
-
143
-
144
-
145
-
146
-
147
-
148
-
149
-
150
-
151
-
152
-
153
-
154
-
155
-
156
-
157
-
158
-
159
-
160
-
161
-
162
-
163
-
164
-
165
-
166
-
167
-
168
-
169
-
170
-
171
-
172
-
173
-
174
-
175
-
176
-
177
-
178
-
179
-
180
 |
 |

F26
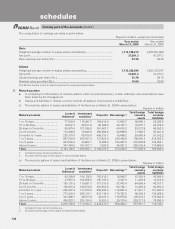
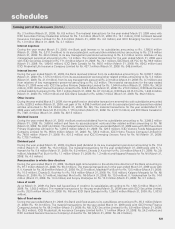
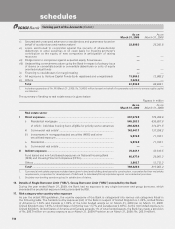
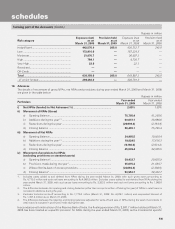
The maximum balance payable to/receivable from subsidiaries/joint ventures/associates/other related entities/
key management personnel and relatives of key management personnel during the year ended March 31, 2008 is
given below:
Rupees in million
Items/Related party Subsidiaries Associates/joint
ventures/other
related entities
Key
Management
Personnel
Relatives of Key
Management
Personnel Total
Deposits with ICICI Bank ...................... 50,517.8 5,603.3 71.4 22.5 56,215.0
Deposits of ICICI Bank .......................... 1,120.8 — — — 1,120.8
Call/term money lent ............................. 17,249.5 — — — 17,249.5
Call/term money borrowed ................... 2,865.0 — — — 2,865.0
Advances .............................................. 11,496.4 1,021.3 28.7 2.2 12,548.6
Investments of ICICI Bank ..................... 88,178.8 18,895.0 — — 107,073.8
Investments of related parties in
ICICI Bank .............................................. 2,250.51— 10.8 1.6 2,262.9
Receivables ........................................... 5,593.5 49.71— — 5,643.2
Payables ................................................ 1,483.41350.11— — 1,833.5
Guarantees ........................................... 3,450.2 2,360.2 — — 5,810.4
Swaps/forward contracts
(notional amount) .................................. 524,892.6 — — — 524,892.6
1. Maximum balances are determined based on comparison of the total outstanding balances as at each quarter end during the
financial year.
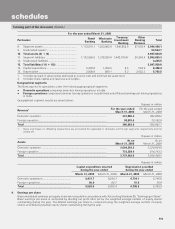
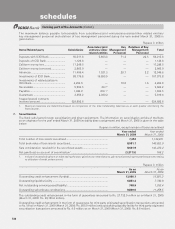
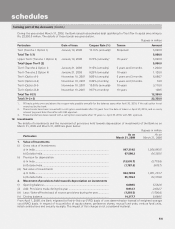
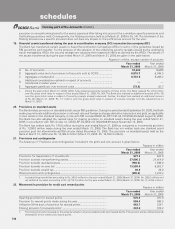
7. Securitisation
The Bank sells loans through securitisation and direct assignment. The information on securitisation activity of the Bank
as an originator for the year ended March 31, 2009 (including direct assignment) and March 31, 2008 is given in the table
below:
Rupees in million, except number of loans securitised
Year ended
March 31, 2009 Year ended
March 31, 2008
Total number of loan assets securitised ......................................................... 7,053 1,149,931
Total book value of loan assets securitised .................................................... 8,581.1 140,852.0
Sale consideration received for the securitised assets .................................. 8,621.9 142,470.4
Net gain/(loss) on account of securitisation1 .................................................. (3,211.5) 168.2
1. Includes loss booked upfront on sales during the year, gain/(loss) on deal closures, gain amortised during the year & expenses relating
to utilisation of credit enhancement.
Rupees in million
As on
March 31, 2009 As on
March 31, 2008
Outstanding credit enhancement (funded) ..................................................... 13,086.1 15,601.2
Outstanding liquidity facility ........................................................................... 6,853.4 7,740.8
Net outstanding servicing asset/(liability) ....................................................... 748.9 1,355.4
Outstanding subordinate contributions .......................................................... 8,849.0 11,459.5
The outstanding credit enhancement in the form of guarantees amounted to Rs. 27,732.9 million as on March 31, 2009
(March 31, 2008: Rs. 29,155.6 million).
Outstanding credit enhancement in the form of guarantees for third party originated securitisation transactions amounted
to Rs. Nil as on March 31, 2009 (March 31, 2008: Rs. 805.0 million) and outstanding liquidity facility for third party originated
securitisation transactions amounted to Rs. 4.0 million as on March 31, 2009 (March 31, 2008: Rs. 8.6 million).
forming part of the Accounts (Contd.)
schedules