ICICI Bank 2009 Annual Report Download - page 105
Download and view the complete annual report
Please find page 105 of the 2009 ICICI Bank annual report below. You can navigate through the pages in the report by either clicking on the pages listed below, or by using the keyword search tool below to find specific information within the annual report.-
 1
1 -
2
-
3
-
4
-
5
-
6
-
7
-
8
-
9
-
10
-
11
-
12
-
13
-
14
-
15
-
16
-
17
-
18
-
19
-
20
-
21
-
22
-
23
-
24
-
25
-
26
-
27
-
28
-
29
-
30
-
31
-
32
-
33
-
34
-
35
-
36
-
37
-
38
-
39
-
40
-
41
-
42
-
43
-
44
-
45
-
46
-
47
-
48
-
49
-
50
-
51
-
52
-
53
-
54
-
55
-
56
-
57
-
58
-
59
-
60
-
61
-
62
-
63
-
64
-
65
-
66
-
67
-
68
-
69
-
70
-
71
-
72
-
73
-
74
-
75
-
76
-
77
-
78
-
79
-
80
-
81
-
82
-
83
-
84
-
85
-
86
-
87
-
88
-
89
-
90
-
91
-
92
-
93
-
94
-
 95
95 -
 96
96 -
 97
97 -
 98
98 -
 99
99 -
 100
100 -
 101
101 -
 102
102 -
 103
103 -
 104
104 -
 105
105 -
 106
106 -
 107
107 -
 108
108 -
 109
109 -
 110
110 -
 111
111 -
 112
112 -
 113
113 -
 114
114 -
 115
115 -
116
-
117
-
118
-
119
-
120
-
121
-
122
-
123
-
124
-
125
-
126
-
127
-
128
-
129
-
130
-
131
-
132
-
133
-
134
-
135
-
136
-
137
-
138
-
139
-
140
-
141
-
142
-
143
-
144
-
145
-
146
-
147
-
148
-
149
-
150
-
151
-
152
-
153
-
154
-
155
-
156
-
157
-
158
-
159
-
160
-
161
-
162
-
163
-
164
-
165
-
166
-
167
-
168
-
169
-
170
-
171
-
172
-
173
-
174
-
175
-
176
-
177
-
178
-
179
-
180
 |
 |

F31
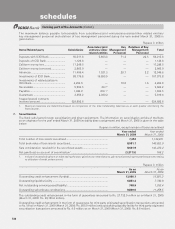
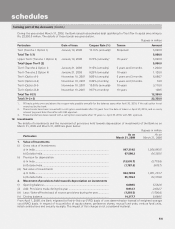
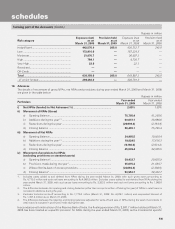
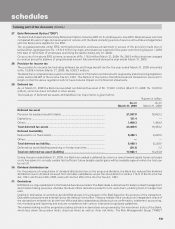
During the year ended March 31, 2008, the Bank raised subordinated debt qualifying for Tier I/Tier II capital amounting to
Rs. 22,350.0 million. The details of these bonds are given below:
Rupees in million
Particulars Date of Issue Coupon Rate (%) Tenure Amount
Tier I (Tranche 1 Option I) January 10, 2008 10.15% (annually)1Perpetual25,000.0
Total Tier I (1) 5,000.0
Upper Tier II (Tranche 1 Option II) January 10, 2008 9.70% (annually)115 years35,000.0
Total Upper Tier II (2) 5,000.0
Tier II (Tranche 2 Option I) January 21, 2008 9.15% (annually) 5 years and 3 months 1,230.0
Tier II (Tranche 2 Option II) January 21, 2008 9.25% (annually) 10 years 1,120.0
Tier II (Option A-I) November 10, 2007 9.80% (annually) 5 years and 3 months 6,098.7
Tier II (Option A-II) November 10, 2007 9.39% (monthly) 5 years and 3 months 74.8
Tier II (Option B-I) November 10, 2007 10.00% (annually) 10 years 3,718.0
Tier II (Option B-II) November 10, 2007 9.57% (monthly) 10 years 108.5
Total Tier II (3) 12,350.0
Total (1+2+3) 22,350.0
1. 50 basis points over and above the coupon rate payable annually for the balance years after April 30, 2018, if the call option is not
exercised by the bank.
2. These bonds have been issued with a call option exercisable after 10 years from the date of issue i.e. April 30, 2018, and on every
interest payment date thereafter with RBI approval.
3. These bonds have been issued with a call option exercisable after 10 years i.e. April 30, 2018, with RBI approval.
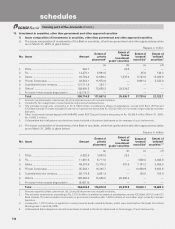
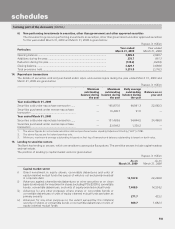
12. Investments
The details of investments and the movement of provisions held towards depreciation of investments of the Bank as on
March 31, 2009 and March 31, 2008 are given below:
Rupees in million
Particulars As on
March 31, 2009 As on
March 31, 2008
1. Value of Investments
(i) Gross value of investments
a) In India .................................................................................................... 947,314.5 1,056,883.5
b) Outside India .......................................................................................... 97,586.3 64,358.5
(ii) Provision for depreciation
a) In India .................................................................................................... (12,530.7) (5,719.8)
b) Outside India .......................................................................................... (1,787.0) (978.7)
(iii) Net value of investments
a) In India .................................................................................................... 934,783.8 1,051,163.7
b) Outside India .......................................................................................... 95,799.3 63,379.8
2. Movement of provisions held towards depreciation on investments
(i) Opening balance ........................................................................................ 6,698.5 5,582.6
(ii) Add: Provisions made during the year ...................................................... 8,912.7 2,622.7
(iii) Less: Write-off/write back of excess provisions during the year .............. (1,293.5) (1,506.8)
(iv) Closing balance .......................................................................................... 14,317.7 6,698.5
From April 1, 2008, the Bank migrated to first-in-first-out (FIFO) basis of cost determination instead of weighted average
cost (WAC) basis, in respect of its portfolios of equity shares, preference shares, mutual fund units, venture fund units,
initial contributions and security receipts. The impact of this change is not considered material.
forming part of the Accounts (Contd.)
schedules