ICICI Bank 2009 Annual Report Download - page 106
Download and view the complete annual report
Please find page 106 of the 2009 ICICI Bank annual report below. You can navigate through the pages in the report by either clicking on the pages listed below, or by using the keyword search tool below to find specific information within the annual report.-
 1
1 -
2
-
3
-
4
-
5
-
6
-
7
-
8
-
9
-
10
-
11
-
12
-
13
-
14
-
15
-
16
-
17
-
18
-
19
-
20
-
21
-
22
-
23
-
24
-
25
-
26
-
27
-
28
-
29
-
30
-
31
-
32
-
33
-
34
-
35
-
36
-
37
-
38
-
39
-
40
-
41
-
42
-
43
-
44
-
45
-
46
-
47
-
48
-
49
-
50
-
51
-
52
-
53
-
54
-
55
-
56
-
57
-
58
-
59
-
60
-
61
-
62
-
63
-
64
-
65
-
66
-
67
-
68
-
69
-
70
-
71
-
72
-
73
-
74
-
75
-
76
-
77
-
78
-
79
-
80
-
81
-
82
-
83
-
84
-
85
-
86
-
87
-
88
-
89
-
90
-
91
-
92
-
93
-
94
-
95
-
 96
96 -
 97
97 -
 98
98 -
 99
99 -
 100
100 -
 101
101 -
 102
102 -
 103
103 -
 104
104 -
 105
105 -
 106
106 -
 107
107 -
 108
108 -
 109
109 -
 110
110 -
 111
111 -
 112
112 -
 113
113 -
 114
114 -
 115
115 -
 116
116 -
117
-
118
-
119
-
120
-
121
-
122
-
123
-
124
-
125
-
126
-
127
-
128
-
129
-
130
-
131
-
132
-
133
-
134
-
135
-
136
-
137
-
138
-
139
-
140
-
141
-
142
-
143
-
144
-
145
-
146
-
147
-
148
-
149
-
150
-
151
-
152
-
153
-
154
-
155
-
156
-
157
-
158
-
159
-
160
-
161
-
162
-
163
-
164
-
165
-
166
-
167
-
168
-
169
-
170
-
171
-
172
-
173
-
174
-
175
-
176
-
177
-
178
-
179
-
180
 |
 |

F32
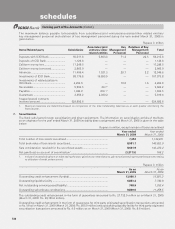
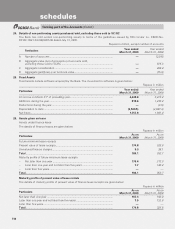
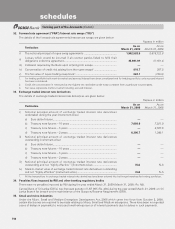
13. Investment in securities, other than government and other approved securities
i) Issuer composition of investments in securities, other than government and other approved securities.
a) The issuer composition of investments of the Bank in securities, other than government and other approved securities
as on March 31, 2009, is given below:
Rupees in million
No. Issuer Amount Extent of
private
placement2
Extent of
‘below
investment
grade’ securities
Extent of
‘unrated’
securities2
Extent of
‘unlisted’
securities3
(a) (b) (c) (d)
1. PSUs ......................................................... 946.1 — 22.8 — —
2. FIs ............................................................. 14,279.1 8,981.6 — 45.6 126.3
3. Banks ........................................................ 40,794.4 12,688.2 1,876.6 8,723.8 15,469.9
4. Private Corporates.................................... 32,554.1 15,972.6 — 8,961.2 5,525.9
5. Subsidiaries/Joint ventures ...................... 131,711.6 324.1 — — —
6. Others4 ..................................................... 188,604.2 73,680.5 33,536.3 — —
7. Provision held towards depreciation ....... (12,174.7) — — — —
Total ......................................................... 396,714.8 111,647.0 35,435.7 17,730.6 21,122.1
1. Amounts reported under columns (a), (b), (c) and (d) above are not mutually exclusive.
2. Includes Rs Nil of application money towards corporate bonds/debentures.
3. This excludes investments, amounting to Rs. 6,192.6 million, in preference shares of subsidiaries, namely ICICI Bank UK PLC and
ICICI Bank Canada. This also excludes investments in government securities Rs. 953.35 million of non-Indian origin made by overseas
branches.
4. Other investments include deposit with NABARD under RIDF Deposit Scheme amounting to Rs. 59,999.4 million (March 31, 2008:
Rs. 14,850.2 million).
5. Collateralised debt obligations securities have been included in the above data based on the arranger of such instruments.
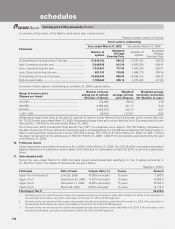
b) The issuer composition of investments of the Bank in securities, other than government and other approved securities
as on March 31, 2008, is given below:
Rupees in million
No. Issuer Amount Extent of
private
placement
Extent of
‘below
investment
grade’ securities
Extent of
‘unrated’
securities2
Extent of
‘unlisted’
securities 2,3
(a) (b) (c) (d)
1. PSUs ......................................................... 6,022.8 3,000.0 22.5 — —
2. FIs ............................................................. 11,601.6 6,711.0 — 1,656.0 3,426.0
3. Banks ........................................................ 40,374.6 13,376.2 437.8 7,101.2 5,456.0
4. Private Corporates.................................... 35,542.1 14,345.7 — 10,068.9 6,633.6
5. Subsidiaries/Joint ventures ...................... 88,178.8 3,851.4 — 150.0 150.0
6. Others ...................................................... 188,582.0 75,586.5 26,358.2 — —
7. Provision held towards depreciation ....... (6,067.9) — — — —
Total ......................................................... 364,234.0 116,870.8 26,818.5 18,976.1 15,665.9
1. Amounts reported under columns (a), (b), (c) and (d) above are not mutually exclusive.
2. This excludes investments, amounting to Rs. 3,701.4 million, in preference shares of subsidiaries, namely ICICI Bank UK PLC and ICICI
Bank Canada. This also excludes investments in government securities (Rs. 1,402.5 million) of non-Indian origin made by overseas
branches.
3. Includes Rs. 1,770.0 million of application money towards bonds issued by banks, which were listed before the Audit Committee
Meeting held on April 25, 2008.
4. Collateralised debt obligations securities have been included in the above data based on the arranger of such instruments.
forming part of the Accounts (Contd.)
schedules