ICICI Bank 2009 Annual Report Download - page 167
Download and view the complete annual report
Please find page 167 of the 2009 ICICI Bank annual report below. You can navigate through the pages in the report by either clicking on the pages listed below, or by using the keyword search tool below to find specific information within the annual report.-
 1
1 -
2
-
3
-
4
-
5
-
6
-
7
-
8
-
9
-
10
-
11
-
12
-
13
-
14
-
15
-
16
-
17
-
18
-
19
-
20
-
21
-
22
-
23
-
24
-
25
-
26
-
27
-
28
-
29
-
30
-
31
-
32
-
33
-
34
-
35
-
36
-
37
-
38
-
39
-
40
-
41
-
42
-
43
-
44
-
45
-
46
-
47
-
48
-
49
-
50
-
51
-
52
-
53
-
54
-
55
-
56
-
57
-
58
-
59
-
60
-
61
-
62
-
63
-
64
-
65
-
66
-
67
-
68
-
69
-
70
-
71
-
72
-
73
-
74
-
75
-
76
-
77
-
78
-
79
-
80
-
81
-
82
-
83
-
84
-
85
-
86
-
87
-
88
-
89
-
90
-
91
-
92
-
93
-
94
-
95
-
96
-
97
-
98
-
99
-
100
-
101
-
102
-
103
-
104
-
105
-
106
-
107
-
108
-
109
-
110
-
111
-
112
-
113
-
114
-
115
-
116
-
117
-
118
-
119
-
120
-
121
-
122
-
123
-
124
-
125
-
126
-
127
-
128
-
129
-
130
-
131
-
132
-
133
-
134
-
135
-
136
-
137
-
138
-
139
-
140
-
141
-
142
-
143
-
144
-
145
-
146
-
147
-
148
-
149
-
150
-
151
-
152
-
153
-
154
-
155
-
156
-
 157
157 -
 158
158 -
 159
159 -
 160
160 -
 161
161 -
 162
162 -
 163
163 -
 164
164 -
 165
165 -
 166
166 -
 167
167 -
 168
168 -
 169
169 -
 170
170 -
 171
171 -
 172
172 -
 173
173 -
 174
174 -
 175
175 -
 176
176 -
 177
177 -
178
-
179
-
180
 |
 |

F93
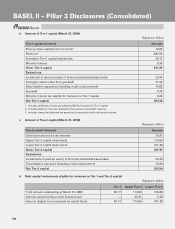
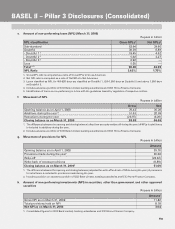
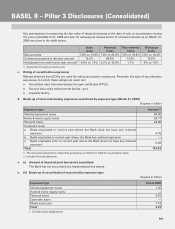
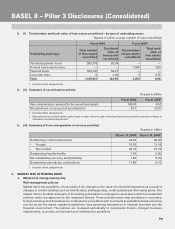
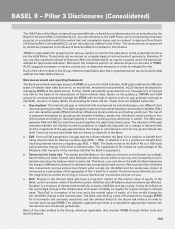
e. Amount of non-performing loans (NPL) (March 31, 2009)
Rupees in billion
NPL classification Gross NPLs1Net NPLs2
Sub-standard 62.94 39.80
Doubtful 30.39 6.89
- Doubtful 1 318.45 4.62
- Doubtful 2 35.02 2.27
- Doubtful 3 36.92 —
Loss 5.05 —
Total 4, 5 98.38 46.69
NPL Ratio 3.62% 1.75%
1. Gross NPL ratio is computed as a ratio of Gross NPLs to Gross Advances.
2. Net NPL ratio is computed as a ratio of Net NPLs to Net Advances.
3. Loans classified as NPL for 456-820 days are classified as Doubtful 1, 820-1,550 days as Doubtful 2 and above 1,550 days
as Doubtful 3.
4. Includes advances portfolio of ICICI Bank Limited, banking subsidiaries and ICICI Home Finance Company.
5. Identification of loans as non-performing is in line with the guidelines issued by regulators of respective entities.
f. Movement of NPL
Rupees in billion
Gross Net
Opening balance as on April 1, 2008 76.42 35.20
Additions during the year1,2 51.93 20.69
Reductions during the year (29.97) (9.20)
Closing balance as on March 31, 2009 98.38 46.69
1. The difference between the opening and closing balance (other than accounts written off during the year) of NPLs in retail loans
is included in additions during the year.
2. Includes advances portfolio of ICICI Bank Limited, banking subsidiaries and ICICI Home Finance Company.
g. Movement of provisions for NPL
Rupees in billion
Amount
Opening balance as on April 1, 2008 39.76
Provisions made during the year136.04
Write-off (23.22)
Write-back of excess provisions (0.89)
Closing balance as on March 31, 2009251.69
1. The difference between the opening and closing balances (adjusted for write-off and sale of NPAs during the year) of provisions
for retail loans is included in provisions made during the year.
2. Includes provision on advances portfolio of ICICI Bank Limited, banking subsidiaries and ICICI Home Finance Company.
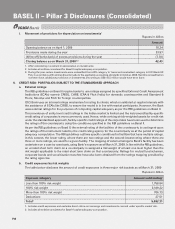
h. Amount of non-performing investments (NPI) in securities, other than government and other approved
securities
Rupees in billion
Amount1
Gross NPI as on March 31, 2009 11.82
Total provisions held on NPI 8.78
Net NPI as on March 31, 2009 3.04
1. Consolidated figures for ICICI Bank Limited, banking subsidiaries and ICICI Home Finance Company.
BASEL II – Pillar 3 Disclosures (Consolidated)