ICICI Bank 2009 Annual Report Download - page 109
Download and view the complete annual report
Please find page 109 of the 2009 ICICI Bank annual report below. You can navigate through the pages in the report by either clicking on the pages listed below, or by using the keyword search tool below to find specific information within the annual report.-
 1
1 -
2
-
3
-
4
-
5
-
6
-
7
-
8
-
9
-
10
-
11
-
12
-
13
-
14
-
15
-
16
-
17
-
18
-
19
-
20
-
21
-
22
-
23
-
24
-
25
-
26
-
27
-
28
-
29
-
30
-
31
-
32
-
33
-
34
-
35
-
36
-
37
-
38
-
39
-
40
-
41
-
42
-
43
-
44
-
45
-
46
-
47
-
48
-
49
-
50
-
51
-
52
-
53
-
54
-
55
-
56
-
57
-
58
-
59
-
60
-
61
-
62
-
63
-
64
-
65
-
66
-
67
-
68
-
69
-
70
-
71
-
72
-
73
-
74
-
75
-
76
-
77
-
78
-
79
-
80
-
81
-
82
-
83
-
84
-
85
-
86
-
87
-
88
-
89
-
90
-
91
-
92
-
93
-
94
-
95
-
96
-
97
-
98
-
 99
99 -
 100
100 -
 101
101 -
 102
102 -
 103
103 -
 104
104 -
 105
105 -
 106
106 -
 107
107 -
 108
108 -
 109
109 -
 110
110 -
 111
111 -
 112
112 -
 113
113 -
 114
114 -
 115
115 -
 116
116 -
 117
117 -
 118
118 -
 119
119 -
120
-
121
-
122
-
123
-
124
-
125
-
126
-
127
-
128
-
129
-
130
-
131
-
132
-
133
-
134
-
135
-
136
-
137
-
138
-
139
-
140
-
141
-
142
-
143
-
144
-
145
-
146
-
147
-
148
-
149
-
150
-
151
-
152
-
153
-
154
-
155
-
156
-
157
-
158
-
159
-
160
-
161
-
162
-
163
-
164
-
165
-
166
-
167
-
168
-
169
-
170
-
171
-
172
-
173
-
174
-
175
-
176
-
177
-
178
-
179
-
180
 |
 |

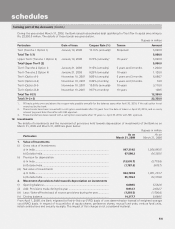
F35
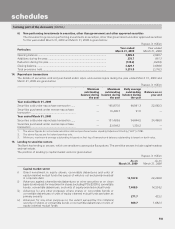
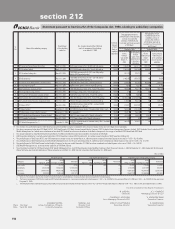
Rupees in million
Risk category Exposure (net)
as on
March 31, 2009
Provision held
as at
March 31, 2009
Exposure (net)
as on
March 31, 2008
Provision held
as at
March 31, 2008
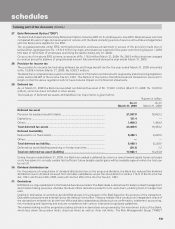
Insignificant ..................................................... 442,570.4 285.0 435,312.7 245.0
Low .................................................................. 172,910.8 — 167,234.5 —
Moderate ......................................................... 21,870.7 — 36,697.3 —
High ................................................................. 784.1 — 4,730.7 —
Very High ......................................................... 22.8 — 22.1 —
Restricted ........................................................ ————
Off-Credit ......................................................... ————
Total ................................................................ 638,158.8 285.0 643,997.3 245.0
- of which funded ............................................ 289,482.0 — 403,791.3 —
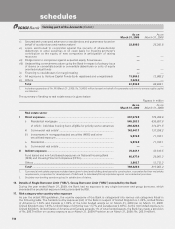
18. Advances
The details of movement of gross NPAs, net NPAs and provisions during year ended March 31, 2009 and March 31, 2008
are given in the table below:
Rupees in million
Particulars Year ended
March 31, 2009 Year ended
March 31, 2008
i) Net NPAs (funded) to Net Advances (%) .................................................... 2.09% 1.55%
ii) Movement of NPAs (Gross)
a) Opening Balance .................................................................................... 75,795.4 41,260.6
b) Additions during the year1, 2 ................................................................... 50,637.1 36,896.6
c) Reductions during the year1 ................................................................... (29,939.4) (2,361.8)
d) Closing balance ..................................................................................... 96,493.1 75,795.4
iii) Movement of Net NPAs
a) Opening Balance .................................................................................... 34,905.5 19,920.4
b) Additions during the year1, 2 ................................................................... 19,824.5 17,616.3
c) Reductions during the year1 ................................................................... (9,190.6) (2,631.2)
d) Closing balance ..................................................................................... 45,539.4 34,905.5
iv) Movement of provisions for NPAs
(excluding provisions on standard assets)
a) Opening Balance3 ................................................................................... 39,432.7 20,835.9
b) Provisions made during the year4 .......................................................... 35,615.4 21,083.7
c) Write-off/write-back of excess provisions ............................................. (24,094.4) (2,486.9)
d) Closing balance3 ..................................................................................... 50,953.7 39,432.7
1. Includes cases added to and deleted from NPAs during the year ended March 31, 2009, with such gross loans amounting to
Rs. 4,713.0 million and such net loans amounting to Rs.4,066.8 million. Excludes cases added to and deleted from NPAs during the
year ended March 31, 2008, with such gross loans amounting to Rs. 2,203.2 million and such net loans amounting to Rs. 1,968.6
million.
2. The difference between the opening and closing balances (other than accounts written off during the year) of NPAs in retail loans is
included in additions during the year.
3. Excludes technical write-off amounting to Rs. 1,179.2 million (March 31, 2008: Rs. 6,076.1 million) and suspended interest of
Rs. 1,457.2 million as on March 31, 2008.
4. The difference between the opening and closing balances (adjusted for write-off and sale of NPAs during the year) of provisions in
retail loans is included in provisions made during the year.
In accordance with instructions of the Reserve Bank of India, the floating provision of Rs. 2,841.7 million held as at March 31,
2008 has been treated as a specific provision for NPAs during the year ended March 31, 2009, as the incremental specific
forming part of the Accounts (Contd.)
schedules