ICICI Bank 2009 Annual Report Download - page 172
Download and view the complete annual report
Please find page 172 of the 2009 ICICI Bank annual report below. You can navigate through the pages in the report by either clicking on the pages listed below, or by using the keyword search tool below to find specific information within the annual report.-
 1
1 -
2
-
3
-
4
-
5
-
6
-
7
-
8
-
9
-
10
-
11
-
12
-
13
-
14
-
15
-
16
-
17
-
18
-
19
-
20
-
21
-
22
-
23
-
24
-
25
-
26
-
27
-
28
-
29
-
30
-
31
-
32
-
33
-
34
-
35
-
36
-
37
-
38
-
39
-
40
-
41
-
42
-
43
-
44
-
45
-
46
-
47
-
48
-
49
-
50
-
51
-
52
-
53
-
54
-
55
-
56
-
57
-
58
-
59
-
60
-
61
-
62
-
63
-
64
-
65
-
66
-
67
-
68
-
69
-
70
-
71
-
72
-
73
-
74
-
75
-
76
-
77
-
78
-
79
-
80
-
81
-
82
-
83
-
84
-
85
-
86
-
87
-
88
-
89
-
90
-
91
-
92
-
93
-
94
-
95
-
96
-
97
-
98
-
99
-
100
-
101
-
102
-
103
-
104
-
105
-
106
-
107
-
108
-
109
-
110
-
111
-
112
-
113
-
114
-
115
-
116
-
117
-
118
-
119
-
120
-
121
-
122
-
123
-
124
-
125
-
126
-
127
-
128
-
129
-
130
-
131
-
132
-
133
-
134
-
135
-
136
-
137
-
138
-
139
-
140
-
141
-
142
-
143
-
144
-
145
-
146
-
147
-
148
-
149
-
150
-
151
-
152
-
153
-
154
-
155
-
156
-
157
-
158
-
159
-
160
-
161
-
 162
162 -
 163
163 -
 164
164 -
 165
165 -
 166
166 -
 167
167 -
 168
168 -
 169
169 -
 170
170 -
 171
171 -
 172
172 -
 173
173 -
 174
174 -
 175
175 -
 176
176 -
 177
177 -
 178
178 -
 179
179 -
 180
180
 |
 |
F98
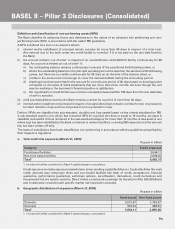
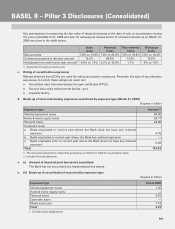
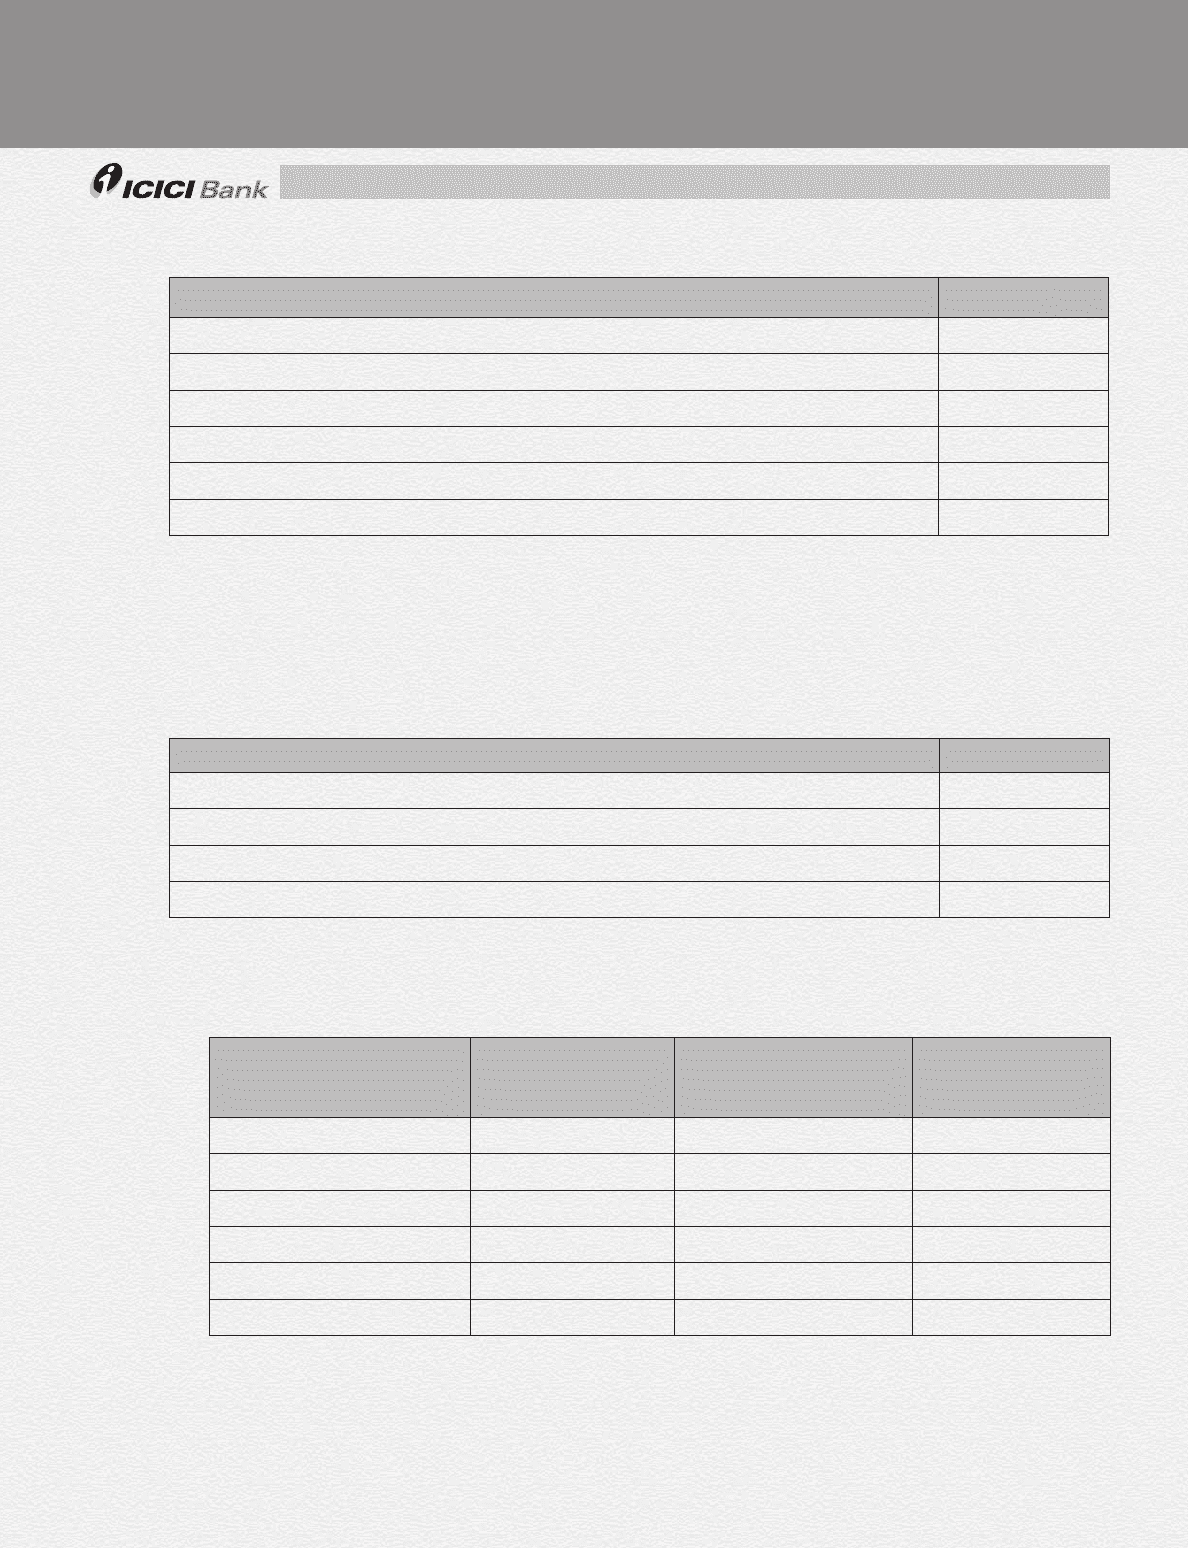
f. Break-up of aggregate amount of securitisation exposures retained or purchased by exposure type1
Rupees in billion
Exposure type March 31, 2009
Vehicle/equipment loans 35.41
Home & home equity loans 50.93
Personal loans 24.94
Corporate loans 4.15
Mixed asset pool 33.54
Total2,3 148.97
1. Securitisation exposures, include, but are not restricted to, securities, liquidity facilities, other commitments and credit
enhancements such as interest only strips, cash collateral accounts and other subordinated assets.
2. Includes direct assignments.
3. Net of provisions.
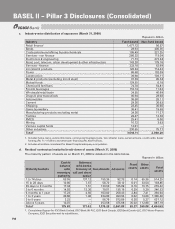
g. (i) Risk weight bands break-up of aggregate amount of securitisation exposures retained or
purchased
Rupees in billion
Risk weight bands March 31, 2009
Less than 100% 68.60
100% 48.61
More than 100% 0.56
Total1117.77
1. Includes direct assignments.
g. (ii) Break-up of securitisation exposures deducted from capital by exposure type
Rupees in billion
Exposure type
Exposures
deducted entirely
from Tier-1 capital1,4
Credit enhancement
(interest only) deducted
from total capital2,4
Other exposures
deducted from total
capital 3,4
Vehicle/equipment loans — 1.55 7.96
Home & home equity loans — 0.07 2.09
Personal loans — 2.39 7.32
Corporate loans — — —
Mixed assets — 0.42 9.39
Total — 4.43 26.76
1. This includes gain on sale of assets.
2. Includes subordinate contribution amount deducted from capital.
3. Includes credit enhancements and capital deducted on PTCs originated by ICICI Bank as well as devolved PTCs & PTCs
purchased in case of third party originated securitisation transactions.
4. Includes direct assignments.
BASEL II – Pillar 3 Disclosures (Consolidated)