Xerox 2015 Annual Report Download - page 99
Download and view the complete annual report
Please find page 99 of the 2015 Xerox annual report below. You can navigate through the pages in the report by either clicking on the pages listed below, or by using the keyword search tool below to find specific information within the annual report.-
 1
1 -
2
-
3
-
4
-
5
-
6
-
7
-
8
-
9
-
10
-
11
-
12
-
13
-
14
-
15
-
16
-
17
-
18
-
19
-
20
-
21
-
22
-
23
-
24
-
25
-
26
-
27
-
28
-
29
-
30
-
31
-
32
-
33
-
34
-
35
-
36
-
37
-
38
-
39
-
40
-
41
-
42
-
43
-
44
-
45
-
46
-
47
-
48
-
49
-
50
-
51
-
52
-
53
-
54
-
55
-
56
-
57
-
58
-
59
-
60
-
61
-
62
-
63
-
64
-
65
-
66
-
67
-
68
-
69
-
70
-
71
-
72
-
73
-
74
-
75
-
76
-
77
-
78
-
79
-
80
-
81
-
82
-
83
-
84
-
85
-
86
-
87
-
88
-
 89
89 -
 90
90 -
 91
91 -
 92
92 -
 93
93 -
 94
94 -
 95
95 -
 96
96 -
 97
97 -
 98
98 -
 99
99 -
 100
100 -
 101
101 -
 102
102 -
 103
103 -
 104
104 -
 105
105 -
 106
106 -
 107
107 -
 108
108 -
 109
109 -
110
-
111
-
112
-
113
-
114
-
115
-
116
-
117
-
118
-
119
-
120
-
121
-
122
-
123
-
124
-
125
-
126
-
127
-
128
-
129
-
130
-
131
-
132
-
133
-
134
-
135
-
136
-
137
-
138
-
139
-
140
-
141
-
142
-
143
-
144
-
145
-
146
-
147
-
148
-
149
-
150
-
151
-
152
-
153
-
154
-
155
-
156
-
157
-
158
 |
 |

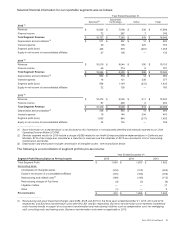
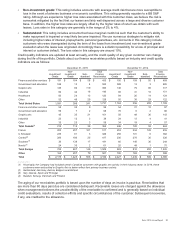
Selected financial information for our reportable segments was as follows:
Year Ended December 31,
Services(2) Document
Technology Other Total
2015 (1)
Revenue $10,065 $7,098 $536 $17,699
Finance income 72 267 7 346
Total Segment Revenue $10,137 $7,365 $543 $18,045
Depreciation and amortization(3) $571 $297 $12$
880
Interest expense 20 108 225 353
Segment profit (loss) 446 879 (267)1,058
Equity in net income of unconsolidated affiliates 27 108 — 135
2014 (1)
Revenue $10,519 $8,044 $590 $19,153
Finance income 65 314 8 387
Total Segment Revenue $10,584 $8,358 $598 $19,540
Depreciation and amortization(3) $602 $334 $14$
950
Interest expense 18 121 238 377
Segment profit (loss) 956 1,149 (272)1,833
Equity in net income of unconsolidated affiliates 32 128 — 160
2013 (1)
Revenue $10,412 $8,500 $611 $19,523
Finance income 67 408 8 483
Total Segment Revenue $10,479 $8,908 $619 $20,006
Depreciation and amortization(3) $536 $345 $14$
895
Interest expense 19 140 244 403
Segment profit (loss) 1,055 964 (217)1,802
Equity in net income of unconsolidated affiliates 34 135 — 169
____________________________
(1) Asset information on a segment basis is not disclosed as this information is not separately identified and internally reported to our Chief
Operating Decision Maker (CODM).
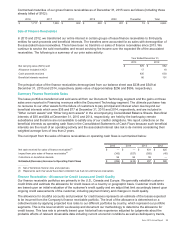
(2) Services segment results for 2015 include a charge of $389 related to our Health Enterprise platform implementations in California and
Montana. $116 of the charge was recorded as a reduction to revenues and the remainder of $273 was recorded to Cost of outsourcing,
maintenance and rentals.
(3) Depreciation and amortization excludes amortization of intangible assets - see reconciliation below.
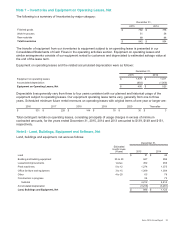
The following is a reconciliation of segment profit to pre-tax income:
Year Ended December 31,
Segment Profit Reconciliation to Pre-tax Income 2015 2014 2013
Total Segment Profit $1,058 $1,833 $1,802
Reconciling items:
Amortization of intangible assets (310)(315)(305)
Equity in net income of unconsolidated affiliates (135)(160)(169)
Restructuring and related costs(1) (196)(149)(115)
Restructuring charges of Fuji Xerox (4) (3) (9)
Litigation matters ——37
Other (1) —2
Pre-tax Income $412 $1,206 $1,243
____________________________
(1) Restructuring and asset impairment charges were $186, $128, and $115 for the three years ended December 31, 2015, 2014 and 2013,
respectively, and Business transformation costs were $10, $21 and $0, respectively. Business transformation costs represent incremental
costs incurred directly in support of our business transformation and restructuring initiatives such as compensation costs for overlapping
staff, consulting costs and training costs. Business transformation costs were not applicable in 2013.
Xerox 2015 Annual Report 82