Xerox 2015 Annual Report Download - page 143
Download and view the complete annual report
Please find page 143 of the 2015 Xerox annual report below. You can navigate through the pages in the report by either clicking on the pages listed below, or by using the keyword search tool below to find specific information within the annual report.-
 1
1 -
2
-
3
-
4
-
5
-
6
-
7
-
8
-
9
-
10
-
11
-
12
-
13
-
14
-
15
-
16
-
17
-
18
-
19
-
20
-
21
-
22
-
23
-
24
-
25
-
26
-
27
-
28
-
29
-
30
-
31
-
32
-
33
-
34
-
35
-
36
-
37
-
38
-
39
-
40
-
41
-
42
-
43
-
44
-
45
-
46
-
47
-
48
-
49
-
50
-
51
-
52
-
53
-
54
-
55
-
56
-
57
-
58
-
59
-
60
-
61
-
62
-
63
-
64
-
65
-
66
-
67
-
68
-
69
-
70
-
71
-
72
-
73
-
74
-
75
-
76
-
77
-
78
-
79
-
80
-
81
-
82
-
83
-
84
-
85
-
86
-
87
-
88
-
89
-
90
-
91
-
92
-
93
-
94
-
95
-
96
-
97
-
98
-
99
-
100
-
101
-
102
-
103
-
104
-
105
-
106
-
107
-
108
-
109
-
110
-
111
-
112
-
113
-
114
-
115
-
116
-
117
-
118
-
119
-
120
-
121
-
122
-
123
-
124
-
125
-
126
-
127
-
128
-
129
-
130
-
131
-
132
-
 133
133 -
 134
134 -
 135
135 -
 136
136 -
 137
137 -
 138
138 -
 139
139 -
 140
140 -
 141
141 -
 142
142 -
 143
143 -
 144
144 -
 145
145 -
 146
146 -
 147
147 -
 148
148 -
 149
149 -
 150
150 -
 151
151 -
 152
152 -
 153
153 -
154
-
155
-
156
-
157
-
158
 |
 |

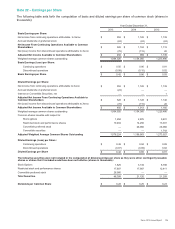
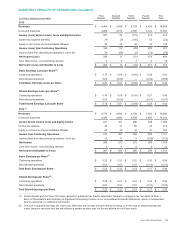
Note 22 – Earnings per Share
The following table sets forth the computation of basic and diluted earnings per share of common stock (shares in
thousands):
Year Ended December 31,
2015 2014 2013
Basic Earnings per Share:
Net income from continuing operations attributable to Xerox $ 552 $1,128 $1,139
Accrued dividends on preferred stock (24)(24)(24)
Net Income From Continuing Operations Available to Common
Shareholders $528 $1,104 $1,115
Net (loss) income from discontinued operations attributable to Xerox (78)(115)20
Adjusted Net Income Available to Common Shareholders $450 $989 $1,135
Weighted-average common shares outstanding 1,064,526 1,154,365 1,225,486
Basic Earnings (Loss) per Share:
Continuing operations $0.50 $0.96 $0.91
Discontinued operations (0.08)(0.10)0.02
Basic Earnings per Share $0.42 $0.86 $0.93
Diluted Earnings per Share:
Net income from continuing operations attributable to Xerox $552 $1,128 $1,139
Accrued dividends on preferred stock (24)——
Interest on Convertible Securities, net —— 1
Adjusted Net Income From Continuing Operations Available to
Common Shareholders $528 $1,128 $1,140
Net (loss) income from discontinued operations attributable to Xerox (78)(115)20
Adjusted Net Income Available to Common Shareholders $450 $1,013 $1,160
Weighted-average common shares outstanding 1,064,526 1,154,365 1,225,486
Common shares issuable with respect to:
Stock options 1,294 2,976 5,401
Restricted stock and performance shares 10,404 14,256 13,931
Convertible preferred stock —26,966 26,966
Convertible securities ——1,743
Adjusted Weighted Average Common Shares Outstanding 1,076,224 1,198,563 1,273,527
Diluted Earnings (Loss) per Share:
Continuing operations $0.49 $0.94 $0.89
Discontinued operations (0.07)(0.09)0.02
Diluted Earnings per Share $0.42 $0.85 $0.91
The following securities were not included in the computation of diluted earnings per share as they were either contingently issuable
shares or shares that if included would have been anti-dilutive (shares in thousands):
Stock Options 1,825 3,139 8,798
Restricted stock and performance shares 17,607 17,987 12,411
Convertible preferred stock 26,966 — —
Total Securities 46,398 21,126 21,209
Dividends per Common Share $0.28 $0.25 $0.23
Xerox 2015 Annual Report 126