Xerox 2015 Annual Report Download - page 53
Download and view the complete annual report
Please find page 53 of the 2015 Xerox annual report below. You can navigate through the pages in the report by either clicking on the pages listed below, or by using the keyword search tool below to find specific information within the annual report.-
 1
1 -
2
-
3
-
4
-
5
-
6
-
7
-
8
-
9
-
10
-
11
-
12
-
13
-
14
-
15
-
16
-
17
-
18
-
19
-
20
-
21
-
22
-
23
-
24
-
25
-
26
-
27
-
28
-
29
-
30
-
31
-
32
-
33
-
34
-
35
-
36
-
37
-
38
-
39
-
40
-
41
-
42
-
 43
43 -
 44
44 -
 45
45 -
 46
46 -
 47
47 -
 48
48 -
 49
49 -
 50
50 -
 51
51 -
 52
52 -
 53
53 -
 54
54 -
 55
55 -
 56
56 -
 57
57 -
 58
58 -
 59
59 -
 60
60 -
 61
61 -
 62
62 -
 63
63 -
64
-
65
-
66
-
67
-
68
-
69
-
70
-
71
-
72
-
73
-
74
-
75
-
76
-
77
-
78
-
79
-
80
-
81
-
82
-
83
-
84
-
85
-
86
-
87
-
88
-
89
-
90
-
91
-
92
-
93
-
94
-
95
-
96
-
97
-
98
-
99
-
100
-
101
-
102
-
103
-
104
-
105
-
106
-
107
-
108
-
109
-
110
-
111
-
112
-
113
-
114
-
115
-
116
-
117
-
118
-
119
-
120
-
121
-
122
-
123
-
124
-
125
-
126
-
127
-
128
-
129
-
130
-
131
-
132
-
133
-
134
-
135
-
136
-
137
-
138
-
139
-
140
-
141
-
142
-
143
-
144
-
145
-
146
-
147
-
148
-
149
-
150
-
151
-
152
-
153
-
154
-
155
-
156
-
157
-
158
 |
 |

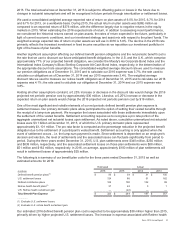
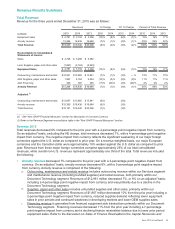
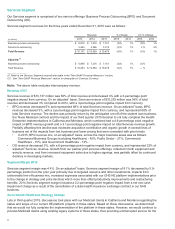
Revenue Results Summary
Total Revenue
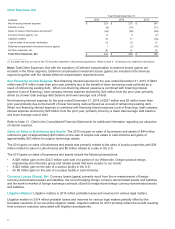
Revenue for the three years ended December 31, 2015 was as follows:
Revenues % Change CC % Change Percent of Total Revenue
(in millions) 2015 2014 2013 2015 2014 2015 2014 2015 2014 2013
Equipment sales $ 2,781 $3,104 $ 3,358 (10)% (8)% (6)% (7)% 15% 16% 17%
Annuity revenue 15,264 16,436 16,648 (7)% (1)% (4)% (1)% 85% 84% 83%
Total Revenue $18,045 $19,540 $ 20,006 (8)% (2)% (4)% (2)% 100%100%100%
Reconciliation to Consolidated
Statements of Income:
Sales $ 4,748 $5,288 $ 5,582
Less: Supplies, paper and other sales (1,967) (2,184) (2,224)
Equipment Sales $2,781 $3,104 $ 3,358 (10)% (8)% (6)% (7)% 15% 16% 17%
Outsourcing, maintenance and rentals $12,951 $13,865 $ 13,941 (7)% (1)% (3)% — % 72% 71% 70%
Add: Supplies, paper and other sales 1,967 2,184 2,224 (10)% (2)% (8)% (2)% 11% 11% 11%
Add: Financing 346 387 483 (11)% (20)% (4)% (20)% 2% 2% 2%
Annuity Revenue $15,264 $16,436 $ 16,648 (7)% (1)% (4)% (1)% 85% 84% 83%
Adjusted: (1)
Outsourcing, maintenance and rentals $13,067 $13,865 $ 13,941 (6)% (2)%
Annuity revenue $15,380 $16,436 $ 16,648 (6)% (3)%
Total Revenue $18,161 $19,540 $ 20,006 (7)% (3)%
_______________
CC - See "Non-GAAP Financial Measures" section for description of Constant Currency
(1) Refer to the Revenue/Segment reconciliation table in the "Non-GAAP Financial Measures" section.
Revenue 2015
Total revenues decreased 8% compared to the prior year with a 4-percentage point negative impact from currency.
On an adjusted1 basis, excluding the HE charge, total revenues decreased 7%, with a 4-percentage point negative
impact from currency. The negative impact from currency reflects the significant weakening of our major foreign
currencies against the U.S. dollar as compared to prior year. On a revenue-weighted basis, our major European
currencies and the Canadian dollar were approximately 16% weaker against the U.S. dollar as compared to prior
year. Revenues from these major foreign currencies comprise approximately 25% of our total consolidated
revenues, while overall non-U.S. revenues represent approximately one third of the total. Total revenues included
the following:
• Annuity revenue decreased 7% compared to the prior year with a 3-percentage point negative impact from
currency. On an adjusted1 basis, annuity revenue decreased 6%, with a 3-percentage point negative impact
from currency. Annuity revenue is comprised of the following:
Outsourcing, maintenance and rentals revenue includes outsourcing revenue within our Services segment
and maintenance revenue (including bundled supplies) and rental revenue, both primarily within our
Document Technology segment. Revenues of $12,951 million decreased 7%, or 6% on an adjusted1 basis,
including a 4-percentage point negative impact from currency and was primarily due to a decline in the
Document Technology segment.
Supplies, paper and other sales includes unbundled supplies and other sales, primarily within our
Document Technology segment. Revenues of $1,967 million decreased 10% from the prior year including a
2-percentage point negative impact from currency, reduced supplies demand reflecting lower equipment
sales in prior periods and continued weakness in developing markets and lower OEM supplies sales.
Financing revenue is generated from financed equipment sale transactions primarily within our Document
Technology segment. Financing revenues decreased 11% from the prior year including a 7-percentage
point negative impact from currency and a declining finance receivables balance due to lower prior period
equipment sales. Refer to the discussion on Sales of Finance Receivable in the Capital Resources and
Xerox 2015 Annual Report 36