Xerox 2015 Annual Report Download - page 42
Download and view the complete annual report
Please find page 42 of the 2015 Xerox annual report below. You can navigate through the pages in the report by either clicking on the pages listed below, or by using the keyword search tool below to find specific information within the annual report.-
 1
1 -
2
-
3
-
4
-
5
-
6
-
7
-
8
-
9
-
10
-
11
-
12
-
13
-
14
-
15
-
16
-
17
-
18
-
19
-
20
-
21
-
22
-
23
-
24
-
25
-
26
-
27
-
28
-
29
-
30
-
31
-
 32
32 -
 33
33 -
 34
34 -
 35
35 -
 36
36 -
 37
37 -
 38
38 -
 39
39 -
 40
40 -
 41
41 -
 42
42 -
 43
43 -
 44
44 -
 45
45 -
 46
46 -
 47
47 -
 48
48 -
 49
49 -
 50
50 -
 51
51 -
 52
52 -
53
-
54
-
55
-
56
-
57
-
58
-
59
-
60
-
61
-
62
-
63
-
64
-
65
-
66
-
67
-
68
-
69
-
70
-
71
-
72
-
73
-
74
-
75
-
76
-
77
-
78
-
79
-
80
-
81
-
82
-
83
-
84
-
85
-
86
-
87
-
88
-
89
-
90
-
91
-
92
-
93
-
94
-
95
-
96
-
97
-
98
-
99
-
100
-
101
-
102
-
103
-
104
-
105
-
106
-
107
-
108
-
109
-
110
-
111
-
112
-
113
-
114
-
115
-
116
-
117
-
118
-
119
-
120
-
121
-
122
-
123
-
124
-
125
-
126
-
127
-
128
-
129
-
130
-
131
-
132
-
133
-
134
-
135
-
136
-
137
-
138
-
139
-
140
-
141
-
142
-
143
-
144
-
145
-
146
-
147
-
148
-
149
-
150
-
151
-
152
-
153
-
154
-
155
-
156
-
157
-
158
 |
 |

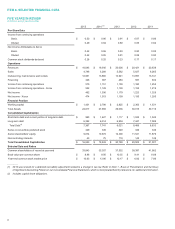
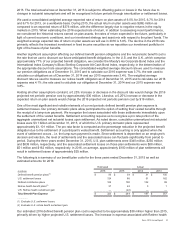
ITEM 6. SELECTED FINANCIAL DATA
FIVE YEARS IN REVIEW
(in millions, except per-share data)
2015 2014
(1) 2013 2012 2011
Per-Share Data
Income from continuing operations
Basic $ 0.50 $0.96 $0.91 $0.87 $0.86
Diluted 0.49 0.94 0.89 0.85 0.84
Net Income Attributable to Xerox
Basic 0.42 0.86 0.93 0.90 0.92
Diluted 0.42 0.85 0.91 0.88 0.90
Common stock dividends declared 0.28 0.25 0.23 0.17 0.17
Operations
Revenues $ 18,045 $ 19,540 $ 20,006 $ 20,421 $20,638
Sales 4,748 5,288 5,582 5,827 6,265
Outsourcing, maintenance and rentals 12,951 13,865 13,941 13,997 13,741
Financing 346 387 483 597 632
Income from continuing operations 570 1,151 1,159 1,180 1,252
Income from continuing operations - Xerox 552 1,128 1,139 1,152 1,219
Net income 492 1,036 1,179 1,223 1,328
Net income - Xerox 474 1,013 1,159 1,195 1,295
Financial Position
Working capital $ 1,431 $2,798 $2,825 $2,363 $1,531
Total Assets 24,817 27,658 29,036 30,015 30,116
Consolidated Capitalization
Short-term debt and current portion of long-term debt $ 985 $1,427 $1,117 $1,042 $1,545
Long-term debt 6,382 6,314 6,904 7,447 7,088
Total Debt(2) 7,367 7,741 8,021 8,489 8,633
Series A convertible preferred stock 349 349 349 349 349
Xerox shareholders' equity 9,074 10,678 12,300 11,521 11,876
Noncontrolling interests 43 75 119 143 149
Total Consolidated Capitalization $16,833 $ 18,843 $ 20,789 $ 20,502 $21,007
Selected Data and Ratios
Common shareholders of record at year-end 33,843 35,307 37,552 39,397 41,982
Book value per common share $ 8.96 $9.56 $10.35 $9.41 $8.88
Year-end common stock market price $ 10.63 $13.86 $12.17 $6.82 $7.96
___________
(1) 2014 was revised for a deferred tax liability adjustment related to a change in tax law. Refer to Note 1 - Basis of Presentation and Summary
of Significant Accounting Policies in our Consolidated Financial Statements, which is incorporated here by reference, for additional information.
(2) Includes capital lease obligations.
25