Xerox 2015 Annual Report Download - page 106
Download and view the complete annual report
Please find page 106 of the 2015 Xerox annual report below. You can navigate through the pages in the report by either clicking on the pages listed below, or by using the keyword search tool below to find specific information within the annual report.-
 1
1 -
2
-
3
-
4
-
5
-
6
-
7
-
8
-
9
-
10
-
11
-
12
-
13
-
14
-
15
-
16
-
17
-
18
-
19
-
20
-
21
-
22
-
23
-
24
-
25
-
26
-
27
-
28
-
29
-
30
-
31
-
32
-
33
-
34
-
35
-
36
-
37
-
38
-
39
-
40
-
41
-
42
-
43
-
44
-
45
-
46
-
47
-
48
-
49
-
50
-
51
-
52
-
53
-
54
-
55
-
56
-
57
-
58
-
59
-
60
-
61
-
62
-
63
-
64
-
65
-
66
-
67
-
68
-
69
-
70
-
71
-
72
-
73
-
74
-
75
-
76
-
77
-
78
-
79
-
80
-
81
-
82
-
83
-
84
-
85
-
86
-
87
-
88
-
89
-
90
-
91
-
92
-
93
-
94
-
95
-
 96
96 -
 97
97 -
 98
98 -
 99
99 -
 100
100 -
 101
101 -
 102
102 -
 103
103 -
 104
104 -
 105
105 -
 106
106 -
 107
107 -
 108
108 -
 109
109 -
 110
110 -
 111
111 -
 112
112 -
 113
113 -
 114
114 -
 115
115 -
 116
116 -
117
-
118
-
119
-
120
-
121
-
122
-
123
-
124
-
125
-
126
-
127
-
128
-
129
-
130
-
131
-
132
-
133
-
134
-
135
-
136
-
137
-
138
-
139
-
140
-
141
-
142
-
143
-
144
-
145
-
146
-
147
-
148
-
149
-
150
-
151
-
152
-
153
-
154
-
155
-
156
-
157
-
158
 |
 |

resolution rates, the aging of receivables, credit quality indicators and the financial health of specific customer
classes or groups. The allowance for doubtful finance receivables is inherently more difficult to estimate than the
allowance for trade accounts receivable because the underlying lease portfolio has an average maturity, at any
time, of approximately two to three years and contains past due billed amounts, as well as unbilled amounts. We
consider all available information in our quarterly assessments of the adequacy of the allowance for doubtful
accounts. The identification of account-specific exposure is not a significant factor in establishing the allowance for
doubtful finance receivables. Our policy and methodology used to establish our allowance for doubtful accounts
has been consistently applied over all periods presented.
Since our allowance for doubtful finance receivables is determined by country, the risk characteristics in our
finance receivable portfolio segments will generally be consistent with the risk factors associated with the
economies of those countries/regions. Loss rates declined in the U.S. reflecting the effects of improved collections
during 2015 and 2014 as well as the lower balance of finance receivables primarily due to sales in 2013 and 2012.
Since Europe is comprised of various countries and regional economies, the risk profile within our European
portfolio segment is somewhat more diversified due to the varying economic conditions among and within the
countries. Charge-offs in Europe were $17 in 2015 as compared to $29 in the prior year, reflecting a significant
improvement from the credit issues that began back in 2011. Loss rates peaked in 2011 as a result of the
European economic challenges particularly for countries in the southern region.
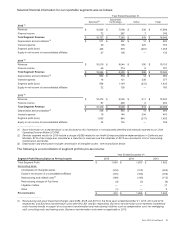
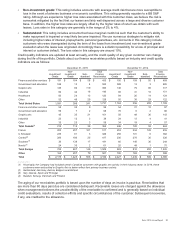
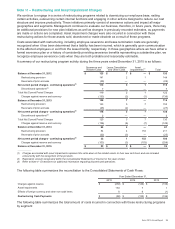
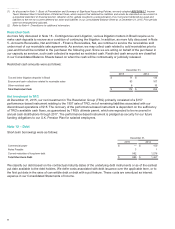
The following table is a rollforward of the allowance for doubtful finance receivables as well as the related investment
in finance receivables:
Allowance for Credit Losses: United States Canada Europe Other(3) Total
Balance at December 31, 2013 $ 45$ 22$ 81$ 6$154
Provision —915933
Charge-offs (5) (14)(29)(3)
(51)
Recoveries and other(1) 1 3 (9) — (5)
Balance at December 31, 2014 41 20 58 12 131
Provision 5 6 10 728
Charge-offs (5) (10)(17)(4)
(36)
Recoveries and other(1) 1 1 (6) (1) (5)
Balance at December 31, 2015 $ 42$ 17$ 45$ 14$ 118
Finance Receivables Collectively Evaluated for
Impairment:
December 31, 2014(2) $1,728 $424 $1,835 $398 $4,385
December 31, 2015(2) $1,731 $365 $1,509 $501 $4,106
__________
(1) Includes the impacts of foreign currency translation and adjustments to reserves necessary to reflect events of non-payment such as
customer accommodations and contract terminations.
(2) Total Finance receivables exclude the allowance for credit losses of $118 and $131 at December 31, 2015 and 2014, respectively.
(3) Includes developing market countries and smaller units.
In the U.S. and Canada, customers are further evaluated or segregated by class based on industry sector. The
primary customer classes are Finance & Other Services, Government & Education; Graphic Arts; Industrial;
Healthcare and Other. In Europe, customers are further grouped by class based on the country or region of the
customer. The primary customer classes include the U.K./Ireland, France and the following European regions -
Central, Nordic and Southern. These groupings or classes are used to understand the nature and extent of our
exposure to credit risk arising from finance receivables.
We evaluate our customers based on the following credit quality indicators:
• Investment grade: This rating includes accounts with excellent to good business credit, asset quality and the
capacity to meet financial obligations. These customers are less susceptible to adverse effects due to shifts in
economic conditions or changes in circumstance. The rating generally equates to a Standard & Poors (S&P)
rating of BBB- or better. Loss rates in this category are normally minimal at less than 1%.
89