Xerox 2015 Annual Report Download - page 129
Download and view the complete annual report
Please find page 129 of the 2015 Xerox annual report below. You can navigate through the pages in the report by either clicking on the pages listed below, or by using the keyword search tool below to find specific information within the annual report.-
 1
1 -
2
-
3
-
4
-
5
-
6
-
7
-
8
-
9
-
10
-
11
-
12
-
13
-
14
-
15
-
16
-
17
-
18
-
19
-
20
-
21
-
22
-
23
-
24
-
25
-
26
-
27
-
28
-
29
-
30
-
31
-
32
-
33
-
34
-
35
-
36
-
37
-
38
-
39
-
40
-
41
-
42
-
43
-
44
-
45
-
46
-
47
-
48
-
49
-
50
-
51
-
52
-
53
-
54
-
55
-
56
-
57
-
58
-
59
-
60
-
61
-
62
-
63
-
64
-
65
-
66
-
67
-
68
-
69
-
70
-
71
-
72
-
73
-
74
-
75
-
76
-
77
-
78
-
79
-
80
-
81
-
82
-
83
-
84
-
85
-
86
-
87
-
88
-
89
-
90
-
91
-
92
-
93
-
94
-
95
-
96
-
97
-
98
-
99
-
100
-
101
-
102
-
103
-
104
-
105
-
106
-
107
-
108
-
109
-
110
-
111
-
112
-
113
-
114
-
115
-
116
-
117
-
118
-
 119
119 -
 120
120 -
 121
121 -
 122
122 -
 123
123 -
 124
124 -
 125
125 -
 126
126 -
 127
127 -
 128
128 -
 129
129 -
 130
130 -
 131
131 -
 132
132 -
 133
133 -
 134
134 -
 135
135 -
 136
136 -
 137
137 -
 138
138 -
 139
139 -
140
-
141
-
142
-
143
-
144
-
145
-
146
-
147
-
148
-
149
-
150
-
151
-
152
-
153
-
154
-
155
-
156
-
157
-
158
 |
 |

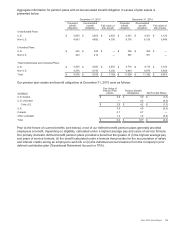
Valuation Method
Our primary Level 3 assets are Real Estate and Private Equity/Venture Capital investments. The fair value of our
real estate investment funds are based on the Net Asset Value (NAV) of our ownership interest in the funds. NAV
information is received from the investment advisers and is primarily derived from third-party real estate appraisals
for the properties owned. The fair value for our private equity/venture capital partnership investments are based on
our share of the estimated fair values of the underlying investments held by these partnerships as reported (or
expected to be reported) in their audited financial statements. The valuation techniques and inputs for our Level 3
assets have been consistently applied for all periods presented.
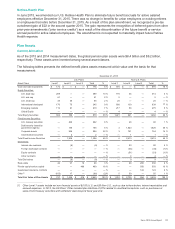
Investment Strategy
The target asset allocations for our worldwide defined benefit pension plans were:
2015 2014
U.S. Non-U.S. U.S. Non-U.S.
Equity investments 34% 29% 33% 34%
Fixed income investments 43% 47% 43% 47%
Real estate 6% 6% 8% 9%
Private equity 9% 10% 9% 6%
Other 8% 8% 7% 4%
Total Investment Strategy 100% 100% 100% 100%
We employ a total return investment approach whereby a mix of equities and fixed income investments are used to
maximize the long-term return of plan assets for a prudent level of risk. The intent of this strategy is to minimize plan
expenses by exceeding the interest growth in long-term plan liabilities. Risk tolerance is established through careful
consideration of plan liabilities, plan funded status and corporate financial condition. This consideration involves the
use of long-term measures that address both return and risk. The investment portfolio contains a diversified blend of
equity and fixed income investments. Furthermore, equity investments are diversified across U.S. and non-U.S.
stocks, as well as growth, value and small and large capitalizations, and may include Company stock. Other assets
such as real estate, private equity, and hedge funds are used to improve portfolio diversification. Derivatives may be
used to hedge market exposure in an efficient and timely manner; however, derivatives may not be used to leverage
the portfolio beyond the market value of the underlying investments. Investment risks and returns are measured and
monitored on an ongoing basis through annual liability measurements and quarterly investment portfolio reviews.
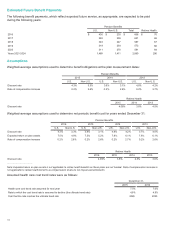
Expected Long-term Rate of Return
We employ a “building block” approach in determining the long-term rate of return for plan assets. Historical
markets are studied and long-term relationships between equities and fixed income are assessed. Current market
factors such as inflation and interest rates are evaluated before long-term capital market assumptions are
determined. The long-term portfolio return is established giving consideration to investment diversification and
rebalancing. Peer data and historical returns are reviewed periodically to assess reasonableness and
appropriateness.
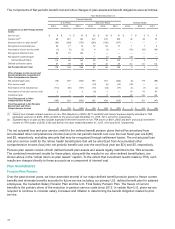
Contributions
In 2015, we made cash contributions of $309 ($177 U.S. and $132 Non-U.S.) and $63 to our defined benefit
pension plans and retiree health benefit plans, respectively.
In 2016, based on current actuarial calculations, we expect to make contributions of approximately $140 ($25 U.S.
and $115 non-U.S.) to our defined benefit pension plans and approximately $70 to our retiree health benefit plans.
The 2016 expected pension plan contributions do not include any planned contribution for our domestic tax-
qualified defined benefit plans because none are required to meet the minimum funding requirements. However,
once the January 1, 2016 actuarial valuations and projected results as of the end of the 2016 measurement year
are available, the desirability of making additional contributions will be reassessed. Based on these results, we may
voluntarily decide to contribute to these plans.
Xerox 2015 Annual Report 112