Xerox 2015 Annual Report Download - page 62
Download and view the complete annual report
Please find page 62 of the 2015 Xerox annual report below. You can navigate through the pages in the report by either clicking on the pages listed below, or by using the keyword search tool below to find specific information within the annual report.-
 1
1 -
2
-
3
-
4
-
5
-
6
-
7
-
8
-
9
-
10
-
11
-
12
-
13
-
14
-
15
-
16
-
17
-
18
-
19
-
20
-
21
-
22
-
23
-
24
-
25
-
26
-
27
-
28
-
29
-
30
-
31
-
32
-
33
-
34
-
35
-
36
-
37
-
38
-
39
-
40
-
41
-
42
-
43
-
44
-
45
-
46
-
47
-
48
-
49
-
50
-
51
-
 52
52 -
 53
53 -
 54
54 -
 55
55 -
 56
56 -
 57
57 -
 58
58 -
 59
59 -
 60
60 -
 61
61 -
 62
62 -
 63
63 -
 64
64 -
 65
65 -
 66
66 -
 67
67 -
 68
68 -
 69
69 -
 70
70 -
 71
71 -
 72
72 -
73
-
74
-
75
-
76
-
77
-
78
-
79
-
80
-
81
-
82
-
83
-
84
-
85
-
86
-
87
-
88
-
89
-
90
-
91
-
92
-
93
-
94
-
95
-
96
-
97
-
98
-
99
-
100
-
101
-
102
-
103
-
104
-
105
-
106
-
107
-
108
-
109
-
110
-
111
-
112
-
113
-
114
-
115
-
116
-
117
-
118
-
119
-
120
-
121
-
122
-
123
-
124
-
125
-
126
-
127
-
128
-
129
-
130
-
131
-
132
-
133
-
134
-
135
-
136
-
137
-
138
-
139
-
140
-
141
-
142
-
143
-
144
-
145
-
146
-
147
-
148
-
149
-
150
-
151
-
152
-
153
-
154
-
155
-
156
-
157
-
158
 |
 |

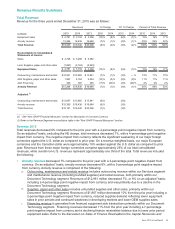
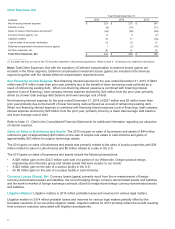
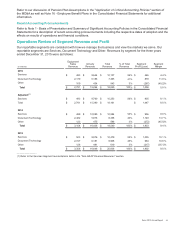
Services Segment
Our Services segment is comprised of two service offerings: Business Process Outsourcing (BPO) and Document
Outsourcing (DO).
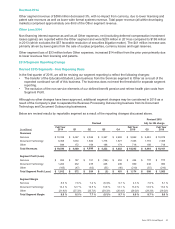
Services segment revenues for the three years ended December 31, 2015 were as follows:
Revenue % Change CC % Change
(in millions) 2015 2014 2013 2015 2014 2015 2014
Business process outsourcing $ 6,872 $ 7,218 $ 7,161 (5)% 1% (3)% 1%
Document outsourcing 3,265 3,366 3,318 (3)% 1% 3 % 2%
Total Revenue $ 10,137 $ 10,584 $ 10,479 (4)% 1% (1)% 1%
Adjusted:(1)
Business process outsourcing $ 6,988 $ 7,218 $ 7,161 (3)% 1% (1)%
Total Revenue $ 10,253 $ 10,584 $ 10,479 (3)% 1% — %
_______________
(1) Refer to the Services Segment reconciliation table in the "Non-GAAP Financial Measures" section.
CC - See "Non-GAAP Financial Measures" section for description of Constant Currency
Note: The above table excludes intercompany revenue.
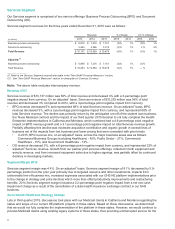
Revenue 2015
Services revenue of $10,137 million was 56% of total revenue and decreased 4% with a 3-percentage point
negative impact from currency. On an adjusted1 basis, Services revenue of $10,253 million was 56% of total
revenue and decreased 3% compared to 2014, with a 3-percentage point negative impact from currency.
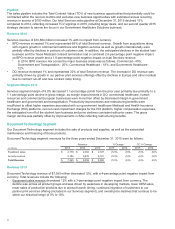
• BPO revenue decreased 5% and represented 68% of total Services revenue. On an adjusted1 basis, BPO
revenue decreased 3%, with a 2-percentage point negative impact from currency, and represented 68% of
total Services revenue. The decline was primarily driven by the anticipated run-off of the student loan business,
the Texas Medicaid contract and the impact of our third quarter 2015 decision to not fully complete the Health
Enterprise implementations in California and Montana, which combined had a 4.6-percentage point negative
impact on BPO revenue growth and a 3.1-percentage point negative impact on total Services revenue growth.
Partially offsetting this decline was moderate acquisition contribution and organic growth in several lines of
business net of the impacts from lost business and lower pricing that were consistent with prior trends.
In 2015, BPO revenue mix, on an adjusted1 basis, across the major business areas was as follows:
Commercial Business Groups (excluding Healthcare) - 45%; Public Sector - 27%; Commercial
Healthcare - 15%; and Government Healthcare - 13%.
• DO revenue decreased 3%, with a 6-percentage point negative impact from currency, and represented 32% of
adjusted1 Services revenue. Growth from our partner print services offerings, reflected in both equipment and
annuity revenue, and from increased equipment sales due to higher signings, was partially offset by continued
declines in developing markets.
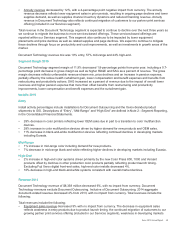
Segment Margin 2015
Services segment margin was 4.4%. On an adjusted1 basis, Services segment margin of 8.1% decreased by 0.9-
percentage points from the prior year primarily due to targeted resource and other investments, impacts from
unfavorable line-of-business mix, increased expenses associated with our GHS HE platform implementations prior
to the change in strategy and price declines which more than offset productivity improvements and restructuring
benefits. 2014 Services segment margin included a 0.2-percentage point negative impact from a net non-cash
impairment charge as a result of the cancellation of a state health insurance exchange contract in our GHS
business.
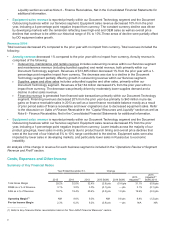
Government Healthcare Strategy Change
Late in third quarter 2015, discussions took place with our Medicaid clients in California and Montana regarding the
status and scope of our current HE platform projects in those states. Based on those discussions, we determined
that we would not fully complete the implementation of the platform in these states. However, we would continue to
process Medicaid claims using existing legacy systems in these states, thus providing uninterrupted service for the
45