Xerox 2015 Annual Report Download - page 43
Download and view the complete annual report
Please find page 43 of the 2015 Xerox annual report below. You can navigate through the pages in the report by either clicking on the pages listed below, or by using the keyword search tool below to find specific information within the annual report.-
 1
1 -
2
-
3
-
4
-
5
-
6
-
7
-
8
-
9
-
10
-
11
-
12
-
13
-
14
-
15
-
16
-
17
-
18
-
19
-
20
-
21
-
22
-
23
-
24
-
25
-
26
-
27
-
28
-
29
-
30
-
31
-
32
-
 33
33 -
 34
34 -
 35
35 -
 36
36 -
 37
37 -
 38
38 -
 39
39 -
 40
40 -
 41
41 -
 42
42 -
 43
43 -
 44
44 -
 45
45 -
 46
46 -
 47
47 -
 48
48 -
 49
49 -
 50
50 -
 51
51 -
 52
52 -
 53
53 -
54
-
55
-
56
-
57
-
58
-
59
-
60
-
61
-
62
-
63
-
64
-
65
-
66
-
67
-
68
-
69
-
70
-
71
-
72
-
73
-
74
-
75
-
76
-
77
-
78
-
79
-
80
-
81
-
82
-
83
-
84
-
85
-
86
-
87
-
88
-
89
-
90
-
91
-
92
-
93
-
94
-
95
-
96
-
97
-
98
-
99
-
100
-
101
-
102
-
103
-
104
-
105
-
106
-
107
-
108
-
109
-
110
-
111
-
112
-
113
-
114
-
115
-
116
-
117
-
118
-
119
-
120
-
121
-
122
-
123
-
124
-
125
-
126
-
127
-
128
-
129
-
130
-
131
-
132
-
133
-
134
-
135
-
136
-
137
-
138
-
139
-
140
-
141
-
142
-
143
-
144
-
145
-
146
-
147
-
148
-
149
-
150
-
151
-
152
-
153
-
154
-
155
-
156
-
157
-
158
 |
 |
ITEM 7. MANAGEMENT'S DISCUSSION AND ANALYSIS OF FINANCIAL CONDITION AND RESULTS OF
OPERATIONS
The following Management’s Discussion and Analysis (MD&A) is intended to help the reader understand the results
of operations and financial condition of Xerox Corporation. MD&A is provided as a supplement to, and should be
read in conjunction with, our Consolidated Financial Statements and the accompanying notes. Throughout the
MD&A, we refer to various notes to our Consolidated Financial Statements which appear in Item 8 of this 2015
Form 10-K, and the information contained in such notes is incorporated by reference into the MD&A in the places
where such references are made.
Throughout this document, references to “we,” “our,” the “Company,” and “Xerox” refer to Xerox Corporation and its
subsidiaries. References to “Xerox Corporation” refer to the stand-alone parent company and do not include its
subsidiaries.
Executive Overview
With revenues of $18.0 billion we are a leader across large, diverse and growing markets estimated at nearly $365
billion. The global business process outsourcing market is very broad, encompassing multi-industry business
processes as well as industry-specific business processes, and our addressable market is estimated at almost $275
billion. The document management market is estimated at about $90 billion and is comprised of the document
systems, software, solutions and services that our customers have relied upon for years to help run their
businesses and reduce their costs. Xerox led the establishment of the managed print services market, and
continues today as the industry leader in this expanding market segment.
Headquartered in Norwalk, Connecticut, the 143,600 people of Xerox serve customers in more than 180 countries
providing business services, printing equipment and software for commercial and government organizations. In
2015, 30% of our revenue was generated outside the U.S.
We organize our business around two main reportable segments: Services and Document Technology.
• Our Services segment is comprised of business process outsourcing (BPO) and document outsourcing
(DO) services.
• Our Document Technology segment is comprised of our document technology and related supplies, technical
service and equipment financing (excluding contracts related to document outsourcing). Our product groups
within this segment include Entry, Mid-Range and High-End products.
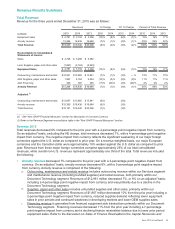
Annuity-Based Business Model
In 2015, 85% of our total revenue was annuity-based, which includes contracted outsourcing services, equipment
maintenance services, consumable supplies and financing, among other elements. Our annuity revenue
significantly benefits from growth in Services. Some of the key indicators of annuity revenue growth include:
• Services signings, which reflects the estimated future revenues from contracts signed during the period, i.e.,
Total Contract Value (TCV).
• Services renewal rate, which is defined as the annual recurring revenue (ARR) on contracts that are renewed
during the period, calculated as a percentage of ARR on all contracts where a renewal decision was made
during the period.
• Services pipeline growth, which measures the increase in new business opportunities.
• Installations of printers and multifunction devices as well as the number of machines in the field (MIF) and the
page volume and mix of pages printed on color devices, where available.
Xerox 2015 Annual Report 26