Xerox 2015 Annual Report Download - page 9
Download and view the complete annual report
Please find page 9 of the 2015 Xerox annual report below. You can navigate through the pages in the report by either clicking on the pages listed below, or by using the keyword search tool below to find specific information within the annual report.-
 1
1 -
 2
2 -
 3
3 -
 4
4 -
 5
5 -
 6
6 -
 7
7 -
 8
8 -
 9
9 -
 10
10 -
 11
11 -
 12
12 -
 13
13 -
 14
14 -
 15
15 -
 16
16 -
 17
17 -
 18
18 -
 19
19 -
 20
20 -
21
-
22
-
23
-
24
-
25
-
26
-
27
-
28
-
29
-
30
-
31
-
32
-
33
-
34
-
35
-
36
-
37
-
38
-
39
-
40
-
41
-
42
-
43
-
44
-
45
-
46
-
47
-
48
-
49
-
50
-
51
-
52
-
53
-
54
-
55
-
56
-
57
-
58
-
59
-
60
-
61
-
62
-
63
-
64
-
65
-
66
-
67
-
68
-
69
-
70
-
71
-
72
-
73
-
74
-
75
-
76
-
77
-
78
-
79
-
80
-
81
-
82
-
83
-
84
-
85
-
86
-
87
-
88
-
89
-
90
-
91
-
92
-
93
-
94
-
95
-
96
-
97
-
98
-
99
-
100
-
101
-
102
-
103
-
104
-
105
-
106
-
107
-
108
-
109
-
110
-
111
-
112
-
113
-
114
-
115
-
116
-
117
-
118
-
119
-
120
-
121
-
122
-
123
-
124
-
125
-
126
-
127
-
128
-
129
-
130
-
131
-
132
-
133
-
134
-
135
-
136
-
137
-
138
-
139
-
140
-
141
-
142
-
143
-
144
-
145
-
146
-
147
-
148
-
149
-
150
-
151
-
152
-
153
-
154
-
155
-
156
-
157
-
158
 |
 |

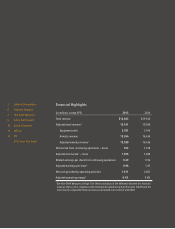
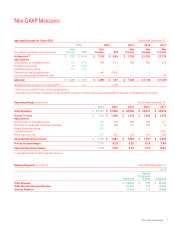
Non-GAAP Measures
Xerox 2015 Annual Report 7
Adjusted Earnings Per Share (EPS) Year Ended December 31,
2015 2014 2013 2012 2011
Net Net Net Net Net
(in millions, except per share amounts) Income EPS Income EPS Income Income Income
As Reported(1) $ 552 $ 0.49 $ 1,128 $ 0.94 $ 1,139 $ 1,152 $ 1,219
Adjustments:
Amortization of intangible assets 193 0.18 196 0.17 189 186 231
Software impairment 90 0.08 – – – – –
Health Enterprise charge 241 0.23 – – – – –
Deferred tax liability adjustment – – (44) (0.04) – – –
Loss on early extinguishment of debt – – – – – – 20
Adjusted $ 1,076 $ 0.98 $ 1,280 $ 1.07 $ 1,328 $ 1,338 $ 1,470
Weighted average shares for adjusted EPS(2) 1,103 1,199
(1) Net income and EPS from continuing operations.
(2) Average shares for the calculation of adjusted EPS include 27 million shares associated with the Series A convertible preferred stock.
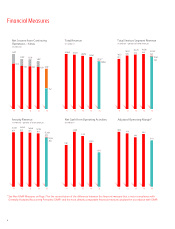
Operating Margin (in millions) Year Ended December 31,
2015(1) 2014 2013 2012 2011
Total Revenues $ 18,161 $ 19,540 $ 20,006 $ 20,421 $ 20,638
Pre-tax Income $ 412 $ 1,206 $ 1,243 $ 1,284 $ 1,450
Adjustments:
Amortization of intangible assets 310 315 305 301 371
Restructuring and asset impairment charges 186 128 115 149 31
Health Enterprise charge 389 – – – –
Curtailment gain – – – – (107)
Other expenses, net 233 232 146 257 320
Adjusted Operating Income $ 1,530 $ 1,881 $ 1,809 $ 1,991 $ 2,065
Pre-tax Income Margin 2.3% 6.2% 6.2% 6.3% 7.0%
Adjusted Operating Margin 8.4% 9.6% 9.0% 9.7% 10.0%
(1) See table below for 2015 adjusted revenue.
Revenue/Segment (in millions) Year Ended December 31,
2015
Health
Enterprise
Reported Charge Adjusted
Total Revenue $ 18,045 $ 116 $ 18,161
Total Services Segment Revenue 10,137 116 10,253
Annuity Revenue 15,264 116 15,380