Xerox 2015 Annual Report Download - page 67
Download and view the complete annual report
Please find page 67 of the 2015 Xerox annual report below. You can navigate through the pages in the report by either clicking on the pages listed below, or by using the keyword search tool below to find specific information within the annual report.-
 1
1 -
2
-
3
-
4
-
5
-
6
-
7
-
8
-
9
-
10
-
11
-
12
-
13
-
14
-
15
-
16
-
17
-
18
-
19
-
20
-
21
-
22
-
23
-
24
-
25
-
26
-
27
-
28
-
29
-
30
-
31
-
32
-
33
-
34
-
35
-
36
-
37
-
38
-
39
-
40
-
41
-
42
-
43
-
44
-
45
-
46
-
47
-
48
-
49
-
50
-
51
-
52
-
53
-
54
-
55
-
56
-
 57
57 -
 58
58 -
 59
59 -
 60
60 -
 61
61 -
 62
62 -
 63
63 -
 64
64 -
 65
65 -
 66
66 -
 67
67 -
 68
68 -
 69
69 -
 70
70 -
 71
71 -
 72
72 -
 73
73 -
 74
74 -
 75
75 -
 76
76 -
 77
77 -
78
-
79
-
80
-
81
-
82
-
83
-
84
-
85
-
86
-
87
-
88
-
89
-
90
-
91
-
92
-
93
-
94
-
95
-
96
-
97
-
98
-
99
-
100
-
101
-
102
-
103
-
104
-
105
-
106
-
107
-
108
-
109
-
110
-
111
-
112
-
113
-
114
-
115
-
116
-
117
-
118
-
119
-
120
-
121
-
122
-
123
-
124
-
125
-
126
-
127
-
128
-
129
-
130
-
131
-
132
-
133
-
134
-
135
-
136
-
137
-
138
-
139
-
140
-
141
-
142
-
143
-
144
-
145
-
146
-
147
-
148
-
149
-
150
-
151
-
152
-
153
-
154
-
155
-
156
-
157
-
158
 |
 |

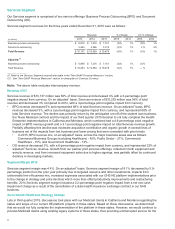
Revenue 2014
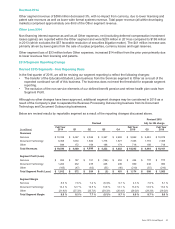
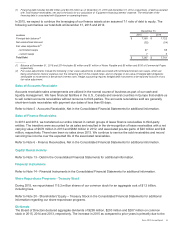
Other segment revenue of $598 million decreased 3%, with no impact from currency, due to lower licensing and
patent sale revenues as well as lower wide format systems revenue. Total paper revenue (all within developing
markets) comprised approximately one-third of the Other segment revenue.
Other Loss 2014
Non-financing interest expense as well as all Other expenses, net (excluding deferred compensation investment
losses (gains)) are reported within the Other segment and were $239 million in 2014 as compared to $198 million
in 2013 (which excludes the $37 favorable resolution of securities litigation matter). The $41 million increase was
primarily driven by lower gains from the sale of surplus properties, currency losses and legal reserves.
Other segment loss of $33 million before Other expenses, increased $14 million from the prior year primarily due
to lower revenues from licensing and patents.
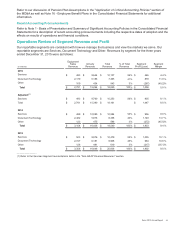
2016 Segment Reporting Change
Revised 2015 Segments - New Reporting Basis
In the first quarter of 2016, we will be revising our segment reporting to reflect the following changes:
• The transfer of the Education/Student Loan business from the Services segment to Other as a result of the
expected continued run-off of this business. The business does not meet the threshold for separate segment
reporting.
• The exclusion of the non-service elements of our defined-benefit pension and retiree-health plan costs from
Segment Profit.
Although no other changes have been approved, additional segment changes may be considered in 2016 as a
result of the Company's plan to separate the Business Processing Outsourcing business from its Document
Technology and Document Outsourcing businesses.
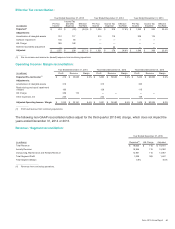
Below are revised results by reportable segment as a result of the reporting changes discussed above.
Revised 2015
Revised Adj. for HE charge
(in millions) Full Year
2014 Q1 Q2 Q3 Q4 Full Year
2015 Q3 Full Year
2015
Revenues
Services $ 10,338 $ 2,467 $ 2,526 $ 2,367 $ 2,602 $ 9,962 $ 2,483 $ 10,078
Document Technology 8,358 1,830 1,880 1,778 1,877 7,365 1,778 7,365
Other 844 172 184 188 174 718 188 718
Total Revenues $ 19,540 $ 4,469 $ 4,590 $ 4,333 $ 4,653 $ 18,045 $ 4,449 $ 18,161
Segment Profit (Loss)
Services $ 893 $ 187 $ 181 $ (196) $ 252 $ 424 $ 193 $813
Document Technology 1,204 232 235 248 245 960 248 960
Other (185) (47) (62) (55) (46) (210) (55)(210)
Total Segment Profit (Loss) $ 1,912 $ 372 $ 354 $ (3) $ 451 $ 1,174 $ 386 $ 1,563
Segment Margin
Services 8.6 %7.6%7.2 % (8.3)% 9.7 % 4.3 % 7.8 % 8.1 %
Document Technology 14.4 % 12.7 % 12.5 % 13.9 % 13.1 % 13.0 % 13.9 %13.0 %
Other (21.9)% (27.3)% (33.7)% (29.3)% (26.4)% (29.2)% (29.3)% (29.2)%
Total Segment Margin 9.8 %8.3%7.7 % (0.1)% 9.7 % 6.5 % 8.7 % 8.6 %
Xerox 2015 Annual Report 50