Xerox 2015 Annual Report Download - page 48
Download and view the complete annual report
Please find page 48 of the 2015 Xerox annual report below. You can navigate through the pages in the report by either clicking on the pages listed below, or by using the keyword search tool below to find specific information within the annual report.-
 1
1 -
2
-
3
-
4
-
5
-
6
-
7
-
8
-
9
-
10
-
11
-
12
-
13
-
14
-
15
-
16
-
17
-
18
-
19
-
20
-
21
-
22
-
23
-
24
-
25
-
26
-
27
-
28
-
29
-
30
-
31
-
32
-
33
-
34
-
35
-
36
-
37
-
 38
38 -
 39
39 -
 40
40 -
 41
41 -
 42
42 -
 43
43 -
 44
44 -
 45
45 -
 46
46 -
 47
47 -
 48
48 -
 49
49 -
 50
50 -
 51
51 -
 52
52 -
 53
53 -
 54
54 -
 55
55 -
 56
56 -
 57
57 -
 58
58 -
59
-
60
-
61
-
62
-
63
-
64
-
65
-
66
-
67
-
68
-
69
-
70
-
71
-
72
-
73
-
74
-
75
-
76
-
77
-
78
-
79
-
80
-
81
-
82
-
83
-
84
-
85
-
86
-
87
-
88
-
89
-
90
-
91
-
92
-
93
-
94
-
95
-
96
-
97
-
98
-
99
-
100
-
101
-
102
-
103
-
104
-
105
-
106
-
107
-
108
-
109
-
110
-
111
-
112
-
113
-
114
-
115
-
116
-
117
-
118
-
119
-
120
-
121
-
122
-
123
-
124
-
125
-
126
-
127
-
128
-
129
-
130
-
131
-
132
-
133
-
134
-
135
-
136
-
137
-
138
-
139
-
140
-
141
-
142
-
143
-
144
-
145
-
146
-
147
-
148
-
149
-
150
-
151
-
152
-
153
-
154
-
155
-
156
-
157
-
158
 |
 |
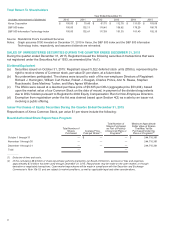
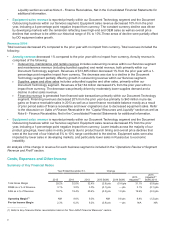
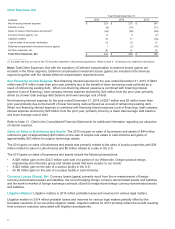
As noted previously, we apply the POC accounting method for arrangements in our government healthcare
business. This includes the implementation of our HE Medicaid platform for various states in the U.S. Changes in
the healthcare market, including evolving regulations, have continued to impact our development work and project
scope for these arrangements including the development work required by our clients and their providers. This has
contributed to delays in meeting client delivery dates as well as increased delivery costs for these contracts. In
addition, the POC estimation process is particularly complex and challenging for these arrangements due to their
significant scope and duration and the highly technical nature of the implementations. As a result, throughout the
respective development and implementation periods, there is the potential for additional changes in contract costs,
productivity, performance penalties and other factors, all of which may result in material increases or decreases in
future revenues and costs.
As an example, during 2015 it was determined that we would not fully complete the HE Medicaid platform
implementation projects in California and Montana. Revenues associated with these implementations were being
recognized using the POC accounting method. As a result of the determination that we will not fully complete these
implementations, we recorded a $116 million write-off of unbilled POC receivables associated with these projects
and additional charges of $273 million. Based on the significance of these projects, we continually monitor the
progress on our remaining HE Medicaid platform implementations and consider the potential for increased costs as
well as risks and uncertainties in our estimates of revenues and costs under the POC accounting methodology. To
the extent possible, we attempt to mitigate these risks through operational changes, project oversight and process
improvements. Total unbilled receivables associated with our current HE Medicaid implementation projects were
$51 million at December 31, 2015.
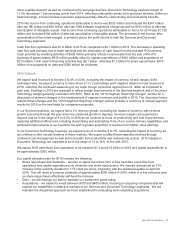
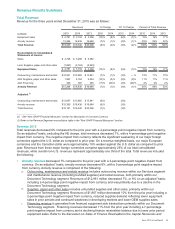
Allowance for Doubtful Accounts and Credit Losses
We continuously monitor collections and payments from our customers and maintain a provision for estimated credit
losses based upon our historical experience adjusted for current conditions. We recorded bad debt provisions of
$53 million, $53 million and $120 million in Selling, Administrative and General Expenses (SAG) expenses in our
Consolidated Statements of Income for the years ended December 31, 2015, 2014 and 2013, respectively.
Bad debt provisions remained fairly flat in 2015 reflecting a consistent trend in write-offs throughout the year as well
as a continued disciplined credit process. Reserves, as a percentage of trade and finance receivables, were 3.0%
at December 31, 2015, as compared to 3.1% and 3.4% at December 31, 2014 and 2013. We continue to assess
our receivable portfolio in light of the current economic environment and its impact on our estimation of the
adequacy of the allowance for doubtful accounts.
As discussed above, we estimated our provision for doubtful accounts based on historical experience and
customer-specific collection issues. This methodology was consistently applied for all periods presented. During the
five year period ended December 31, 2015, our reserve for doubtful accounts ranged from 3.0% to 3.4% of gross
receivables. Holding all assumptions constant, a 0.5-percentage point increase or decrease in the reserve from the
December 31, 2015 rate of 3.0% would change the 2015 provision by approximately $33 million.
Refer to Note 5 - Accounts Receivables, Net and Note 6 - Finance Receivables, Net in the Consolidated Financial
Statements for additional information regarding our allowance for doubtful accounts.
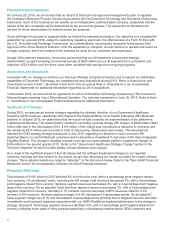
Pension Plan Assumptions
We sponsor defined benefit pension plans in various forms in several countries covering employees who meet
eligibility requirements. Several statistical and other factors that attempt to anticipate future events are used in
calculating the expense, liability and asset values related to our defined benefit pension plans. These factors include
assumptions we make about the expected return on plan assets, discount rate, lump-sum settlement rates, the rate
of future compensation increases and mortality. Differences between these assumptions and actual experiences are
reported as net actuarial gains and losses and are subject to amortization to net periodic benefit cost over future
periods. Over the past several years, we have amended several of our major defined benefit pension plans to
freeze current benefits and eliminate benefit accruals for future service. The freeze of current benefits is the primary
driver of the reduction in pension service costs since 2013. In certain plans we are required by law or statute to
continue to reflect salary increases and inflation in determining the benefit obligation related to prior service.
Cumulative net actuarial losses for our defined benefit pension plans of $3.1 billion as of December 31, 2015
decreased by $223 million from December 31, 2014, reflecting the decrease in our benefit obligations as a result of
higher discount rates and the recognition of actuarial losses through amortization and U.S. settlement losses. These
impacts were partially offset by losses as a result of actual plan asset returns being less than expected returns in
31