Xerox 2015 Annual Report Download - page 112
Download and view the complete annual report
Please find page 112 of the 2015 Xerox annual report below. You can navigate through the pages in the report by either clicking on the pages listed below, or by using the keyword search tool below to find specific information within the annual report.-
 1
1 -
2
-
3
-
4
-
5
-
6
-
7
-
8
-
9
-
10
-
11
-
12
-
13
-
14
-
15
-
16
-
17
-
18
-
19
-
20
-
21
-
22
-
23
-
24
-
25
-
26
-
27
-
28
-
29
-
30
-
31
-
32
-
33
-
34
-
35
-
36
-
37
-
38
-
39
-
40
-
41
-
42
-
43
-
44
-
45
-
46
-
47
-
48
-
49
-
50
-
51
-
52
-
53
-
54
-
55
-
56
-
57
-
58
-
59
-
60
-
61
-
62
-
63
-
64
-
65
-
66
-
67
-
68
-
69
-
70
-
71
-
72
-
73
-
74
-
75
-
76
-
77
-
78
-
79
-
80
-
81
-
82
-
83
-
84
-
85
-
86
-
87
-
88
-
89
-
90
-
91
-
92
-
93
-
94
-
95
-
96
-
97
-
98
-
99
-
100
-
101
-
 102
102 -
 103
103 -
 104
104 -
 105
105 -
 106
106 -
 107
107 -
 108
108 -
 109
109 -
 110
110 -
 111
111 -
 112
112 -
 113
113 -
 114
114 -
 115
115 -
 116
116 -
 117
117 -
 118
118 -
 119
119 -
 120
120 -
 121
121 -
 122
122 -
123
-
124
-
125
-
126
-
127
-
128
-
129
-
130
-
131
-
132
-
133
-
134
-
135
-
136
-
137
-
138
-
139
-
140
-
141
-
142
-
143
-
144
-
145
-
146
-
147
-
148
-
149
-
150
-
151
-
152
-
153
-
154
-
155
-
156
-
157
-
158
 |
 |

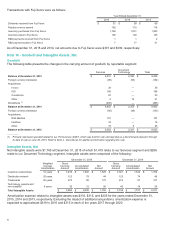
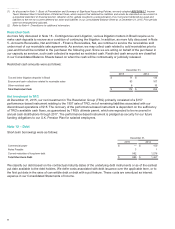
Transactions with Fuji Xerox were as follows:
Year Ended December 31,
2015 2014 2013
Dividends received from Fuji Xerox $ 51 $ 58 $ 60
Royalty revenue earned 102 115 118
Inventory purchases from Fuji Xerox 1,728 1,831 1,903
Inventory sales to Fuji Xerox 108 120 145
R&D payments received from Fuji Xerox 1 12
R&D payments paid to Fuji Xerox 7 17 21
As of December 31, 2015 and 2014, net amounts due to Fuji Xerox were $307 and $339, respectively.
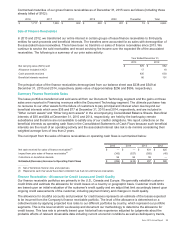
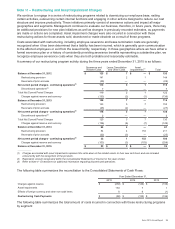
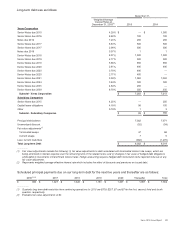
Note 10 - Goodwill and Intangible Assets, Net
Goodwill
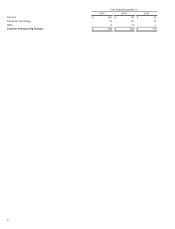
The following table presents the changes in the carrying amount of goodwill, by reportable segment:
Services
Document
Technology Total
Balance at December 31, 2013 $6,815 $2,390 $9,205
Foreign currency translation (98)(56)(154)
Acquisitions:
Invoco 39 —39
ISG 166 — 166
Consilience 23 —23
Other 21921
Divestitures (1) (495)— (495)
Balance at December 31, 2014 $6,452 $2,353 $8,805
Foreign currency translation (95)(38)(133)
Acquisitions:
RSA Medical 107 — 107
Intellinex 19 —19
Other 19 625
Balance at December 31, 2015 $6,502 $2,321 $8,823
___________
(1) Primarily represents goodwill related to our ITO business ($487), which was held for sale and reported as a discontinued operation through
its date of sale on June 30, 2015. Refer to Note 4 - Divestitures for additional information regarding this sale.
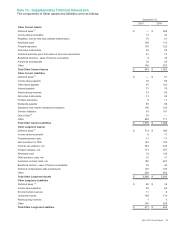
Intangible Assets, Net
Net intangible assets were $1,765 at December 31, 2015 of which $1,479 relate to our Services segment and $286
relate to our Document Technology segment. Intangible assets were comprised of the following:
December 31, 2015 December 31, 2014
Weighted
Average
Amortization
Gross
Carrying
Amount
Accumulated
Amortization
Net
Amount
Gross
Carrying
Amount
Accumulated
Amortization
Net
Amount
Customer relationships 12 years $ 3,435 $1,906 $1,529 $3,301 $1,532 $1,769
Distribution network 25 years 123 79 44 123 74 49
Trademarks 20 years 270 98 172 274 87 187
Technology, patents and
non-compete 9 years 32 12 20 40 14 26
Total Intangible Assets $
3,860 $2,095 $1,765 $3,738 $1,707 $2,031
Amortization expense related to intangible assets was $310, $315, and $305 for the years ended December 31,
2015, 2014 and 2013, respectively. Excluding the impact of additional acquisitions, amortization expense is
expected to approximate $319 in 2016 and $315 in each of the years 2017 through 2020.
95