Xerox 2015 Annual Report Download - page 68
Download and view the complete annual report
Please find page 68 of the 2015 Xerox annual report below. You can navigate through the pages in the report by either clicking on the pages listed below, or by using the keyword search tool below to find specific information within the annual report.-
 1
1 -
2
-
3
-
4
-
5
-
6
-
7
-
8
-
9
-
10
-
11
-
12
-
13
-
14
-
15
-
16
-
17
-
18
-
19
-
20
-
21
-
22
-
23
-
24
-
25
-
26
-
27
-
28
-
29
-
30
-
31
-
32
-
33
-
34
-
35
-
36
-
37
-
38
-
39
-
40
-
41
-
42
-
43
-
44
-
45
-
46
-
47
-
48
-
49
-
50
-
51
-
52
-
53
-
54
-
55
-
56
-
57
-
 58
58 -
 59
59 -
 60
60 -
 61
61 -
 62
62 -
 63
63 -
 64
64 -
 65
65 -
 66
66 -
 67
67 -
 68
68 -
 69
69 -
 70
70 -
 71
71 -
 72
72 -
 73
73 -
 74
74 -
 75
75 -
 76
76 -
 77
77 -
 78
78 -
79
-
80
-
81
-
82
-
83
-
84
-
85
-
86
-
87
-
88
-
89
-
90
-
91
-
92
-
93
-
94
-
95
-
96
-
97
-
98
-
99
-
100
-
101
-
102
-
103
-
104
-
105
-
106
-
107
-
108
-
109
-
110
-
111
-
112
-
113
-
114
-
115
-
116
-
117
-
118
-
119
-
120
-
121
-
122
-
123
-
124
-
125
-
126
-
127
-
128
-
129
-
130
-
131
-
132
-
133
-
134
-
135
-
136
-
137
-
138
-
139
-
140
-
141
-
142
-
143
-
144
-
145
-
146
-
147
-
148
-
149
-
150
-
151
-
152
-
153
-
154
-
155
-
156
-
157
-
158
 |
 |

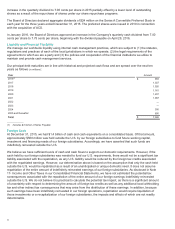
Capital Resources and Liquidity
Our liquidity is primarily dependent on our ability to continue to generate strong cash flows from operations.
Additional liquidity is also provided through access to the financial capital markets, including the Commercial Paper
market, as well as a committed global credit facility. The following is a summary of our liquidity position:
• As of December 31, 2015 and 2014, total cash and cash equivalents were $1,368 million and $1,411 million,
respectively. There were no borrowings under our Commercial Paper Program at December 31, 2015 versus
$150 million of borrowings at December 31, 2014. There were no borrowings or letters of credit under our $2
billion Credit Facility at either year end.
• Over the past three years we have consistently delivered strong cash flows from operations driven by the
strength of our annuity-based revenue model. Cash flows from operations was $1,611 million, $2,063 million and
$2,375 million for the three years ended December 31, 2015, respectively. The decrease in 2015 cash flow from
operations was primarily due to lower earnings and the elimination of cash flows from the disposed ITO
business. Cash flows from operations for all periods reflect the cash impacts from the sales of finance
receivables - refer to Sales of Finance Receivables within this section.
• We expect cash flows from operations to be between $1.3 and $1.5 billion in 2016, which reflects expected cash
outflows for the HE settlement charge and higher restructuring payments.
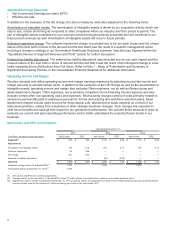
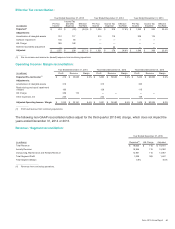
Cash Flow Analysis
The following summarizes our cash flows for the three years ended December 31, 2015, as reported in our
Consolidated Statements of Cash Flows in the accompanying Consolidated Financial Statements:
Year Ended December 31, Change
(in millions) 2015 2014 2013 2015 2014
Net cash provided by operating activities $ 1,611 $2,063 $2,375 $(452) $ (312)
Net cash provided by (used in) investing activities 508 (703)(452)1,211 (251)
Net cash used in financing activities (2,074) (1,624) (1,402) (450) (222)
Effect of exchange rate changes on cash and cash equivalents (88)(89)(3) 1(86)
(Decrease) increase in cash and cash equivalents (43)(353)518 310 (871)
Cash and cash equivalents at beginning of year 1,411 1,764 1,246 (353) 518
Cash and Cash Equivalents at End of Year $1,368 $1,411 $1,764 $(43) $ (353)
Cash Flows from Operating Activities
Net cash provided by operating activities was $1,611 million for the year ended December 31, 2015. The $452 million
decrease in operating cash from 2014 was primarily due to the following:
• $503 million decrease in pre-tax income before depreciation and amortization, gain on sales of businesses and
assets, stock-based compensation and restructuring charges as well as the HE charge.
• $105 million decrease due to the expected loss of cash flow associated with the ITO business, post-divestiture.
• $79 million decrease primarily due to higher levels of inventory following lower equipment and supplies demand.
• $31 million decrease from finance receivables primarily related to a lower net run-off as a result of an increase in
originations. This was partially offset by a lower impact from the prior year sales of receivables. Refer to Note 6 -
Finance Receivables, Net in the Consolidated Financial Statements for additional information regarding the sale
of finance receivables.
• $25 million decrease primarily due to higher discretionary pension contributions in the U.S. offset by lower
contributions in the international plans.
• $90 million decrease in accounts payable and accrued compensation primarily related to the timing of payments
and an increase in days payable outstanding as well as lower compensation accruals.
• $256 million increase from accounts receivable primarily due to additional sales of accounts receivable under
existing programs. In addition, the increase reflects improved collections, select use of prompt pay discounts and
lower revenues.
• $35 million increase from lower restructuring payments due to lower activity.
• $29 million increase from lower spending for up-front costs for outsourcing service contracts.
Cash flow from operations in 2015 and 2014 include approximately $40 million and $145 million, respectively, of cash
flows from our ITO business, which was held for sale and reported as a discontinued operation through its sale on
June 30, 2015. Refer to Note 4 - Divestitures in the Consolidated Financial Statements for additional information.
51