Xerox 2015 Annual Report Download - page 82
Download and view the complete annual report
Please find page 82 of the 2015 Xerox annual report below. You can navigate through the pages in the report by either clicking on the pages listed below, or by using the keyword search tool below to find specific information within the annual report.-
 1
1 -
2
-
3
-
4
-
5
-
6
-
7
-
8
-
9
-
10
-
11
-
12
-
13
-
14
-
15
-
16
-
17
-
18
-
19
-
20
-
21
-
22
-
23
-
24
-
25
-
26
-
27
-
28
-
29
-
30
-
31
-
32
-
33
-
34
-
35
-
36
-
37
-
38
-
39
-
40
-
41
-
42
-
43
-
44
-
45
-
46
-
47
-
48
-
49
-
50
-
51
-
52
-
53
-
54
-
55
-
56
-
57
-
58
-
59
-
60
-
61
-
62
-
63
-
64
-
65
-
66
-
67
-
68
-
69
-
70
-
71
-
 72
72 -
 73
73 -
 74
74 -
 75
75 -
 76
76 -
 77
77 -
 78
78 -
 79
79 -
 80
80 -
 81
81 -
 82
82 -
 83
83 -
 84
84 -
 85
85 -
 86
86 -
 87
87 -
 88
88 -
 89
89 -
 90
90 -
 91
91 -
 92
92 -
93
-
94
-
95
-
96
-
97
-
98
-
99
-
100
-
101
-
102
-
103
-
104
-
105
-
106
-
107
-
108
-
109
-
110
-
111
-
112
-
113
-
114
-
115
-
116
-
117
-
118
-
119
-
120
-
121
-
122
-
123
-
124
-
125
-
126
-
127
-
128
-
129
-
130
-
131
-
132
-
133
-
134
-
135
-
136
-
137
-
138
-
139
-
140
-
141
-
142
-
143
-
144
-
145
-
146
-
147
-
148
-
149
-
150
-
151
-
152
-
153
-
154
-
155
-
156
-
157
-
158
 |
 |

XEROX CORPORATION
CONSOLIDATED STATEMENTS OF INCOME
Year Ended December 31,
(in millions, except per-share data) 2015 2014 2013
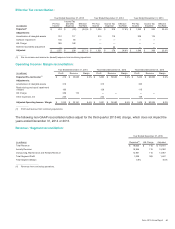
Revenues
Sales $ 4,748 $5,288 $5,582
Outsourcing, maintenance and rentals 12,951 13,865 13,941
Financing 346 387 483
Total Revenues 18,045 19,540 20,006
Costs and Expenses
Cost of sales 2,961 3,269 3,550
Cost of outsourcing, maintenance and rentals 9,691 9,885 9,808
Cost of financing 130 140 163
Research, development and engineering expenses 563 577 603
Selling, administrative and general expenses 3,559 3,788 4,073
Restructuring and asset impairment charges 186 128 115
Amortization of intangible assets 310 315 305
Other expenses, net 233 232 146
Total Costs and Expenses 17,633 18,334 18,763
Income Before Income Taxes and Equity Income 412 1,206 1,243
Income tax (benefit) expense (23)215 253
Equity in net income of unconsolidated affiliates 135 160 169
Income from Continuing Operations 570 1,151 1,159
(Loss) income from discontinued operations, net of tax (78)(115)20
Net Income 492 1,036 1,179
Less: Net income attributable to noncontrolling interests 18 23 20
Net Income Attributable to Xerox $474 $1,013 $1,159
Amounts attributable to Xerox:
Net income from continuing operations $ 552 $1,128 $1,139
(Loss) income from discontinued operations, net of tax (78)(115)20
Net Income Attributable to Xerox $474 $1,013 $1,159
Basic Earnings per Share:
Continuing operations $ 0.50 $0.96 $0.91
Discontinued operations (0.08)(0.10)0.02
Total Basic Earnings per Share $0.42 $0.86 $0.93
Diluted Earnings per Share:
Continuing operations $ 0.49 $0.94 $0.89
Discontinued operations (0.07)(0.09)0.02
Total Diluted Earnings per Share $0.42 $0.85 $0.91
The accompanying notes are an integral part of these Consolidated Financial Statements.
65