Xerox 2015 Annual Report Download - page 76
Download and view the complete annual report
Please find page 76 of the 2015 Xerox annual report below. You can navigate through the pages in the report by either clicking on the pages listed below, or by using the keyword search tool below to find specific information within the annual report.-
 1
1 -
2
-
3
-
4
-
5
-
6
-
7
-
8
-
9
-
10
-
11
-
12
-
13
-
14
-
15
-
16
-
17
-
18
-
19
-
20
-
21
-
22
-
23
-
24
-
25
-
26
-
27
-
28
-
29
-
30
-
31
-
32
-
33
-
34
-
35
-
36
-
37
-
38
-
39
-
40
-
41
-
42
-
43
-
44
-
45
-
46
-
47
-
48
-
49
-
50
-
51
-
52
-
53
-
54
-
55
-
56
-
57
-
58
-
59
-
60
-
61
-
62
-
63
-
64
-
65
-
 66
66 -
 67
67 -
 68
68 -
 69
69 -
 70
70 -
 71
71 -
 72
72 -
 73
73 -
 74
74 -
 75
75 -
 76
76 -
 77
77 -
 78
78 -
 79
79 -
 80
80 -
 81
81 -
 82
82 -
 83
83 -
 84
84 -
 85
85 -
 86
86 -
87
-
88
-
89
-
90
-
91
-
92
-
93
-
94
-
95
-
96
-
97
-
98
-
99
-
100
-
101
-
102
-
103
-
104
-
105
-
106
-
107
-
108
-
109
-
110
-
111
-
112
-
113
-
114
-
115
-
116
-
117
-
118
-
119
-
120
-
121
-
122
-
123
-
124
-
125
-
126
-
127
-
128
-
129
-
130
-
131
-
132
-
133
-
134
-
135
-
136
-
137
-
138
-
139
-
140
-
141
-
142
-
143
-
144
-
145
-
146
-
147
-
148
-
149
-
150
-
151
-
152
-
153
-
154
-
155
-
156
-
157
-
158
 |
 |

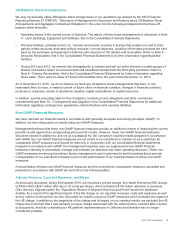
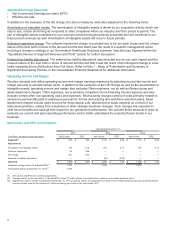
Adjusted Earnings Measures
• Net income and Earnings per share (EPS)
• Effective tax rate
In addition to the exclusion of the HE charge, the above measures were also adjusted for the following items:
Amortization of intangible assets: The amortization of intangible assets is driven by our acquisition activity which can
vary in size, nature and timing as compared to other companies within our industry and from period to period. The
use of intangible assets contributed to our revenues earned during the periods presented and will contribute to our
future period revenues as well. Amortization of intangible assets will recur in future periods.
Software impairment charge: The software impairment charge is excluded due to its non-cash impact and the unique
nature of the item both in terms of the amount and the fact that it was the result of a specific management action
involving a change in strategy in our Government Healthcare Solutions business. See Services Segment within the
"Operations Review of Segment Revenue and Profit" section for further discussion.
Deferred tax liability adjustment: The deferred tax liability adjustment was excluded due its non-cash impact and the
unusual nature of the item both in terms of amount and the fact that it was the result of an infrequent change in a tax
treaty impacting future distributions from Fuji Xerox. Refer to Note 1 - Basis of Presentation and Summary of
Significant Accounting Policies, in the Consolidated Financial Statements for additional information.
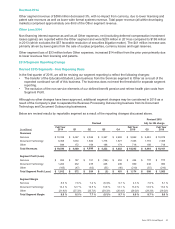
Operating Income and Margin
We also calculate and utilize operating income and margin earnings measures by adjusting our pre-tax income and
margin amounts to exclude certain items. In addition to the exclusion of the HE Charge as well as the amortization of
intangible assets, operating income and margin also excludes Other expenses, net as well as Restructuring and
asset impairment charges. Other expenses, net is primarily comprised of non-financing interest expense and also
includes certain other non-operating costs and expenses. Restructuring charges consist of costs primarily related to
severance and benefits paid to employees pursuant to formal restructuring and workforce reduction plans. Asset
impairment charges include costs incurred for those assets sold, abandoned or made obsolete as a result of our
restructuring actions, exiting from a business or other strategic business changes. Such charges are expected to
yield future benefits and savings with respect to our operational performance. We exclude these amounts in order to
evaluate our current and past operating performance and to better understand the expected future trends in our
business.
Net Income and EPS reconciliation:
Year Ended December 31,
2015 2014 2013
(in millions; except per share amounts) Net Income EPS Net Income EPS Net Income EPS
Reported(1) $ 552 $ 0.49 $ 1,128 $ 0.94 $ 1,139 $0.89
Adjustments:
Amortization of intangible assets 193 0.18 196 0.17 189 0.15
Software Impairment 900.08————
HE Charge 241 0.23 ————
Deferred tax liability adjustment — — (44) (0.04) — —
Adjusted $ 1,076 $ 0.98 $ 1,280 $ 1.07 $ 1,328 $1.04
Weighted average shares for adjusted EPS(2) 1,103 1,199 1,274
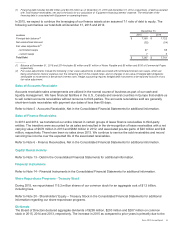
Fully diluted shares at December 31, 2015(3) 1,046
___________
(1) Net income and EPS from continuing operations.
(2) Average shares for the calculation of adjusted EPS include 27 million shares associated with our Series A convertible preferred stock.
(3) Represents common shares outstanding at December 31, 2015 as well as shares associated with our Series A convertible preferred stock plus potential dilutive
common shares used for the calculation of diluted earnings per share for the year ended 2015.
59