Xerox 2015 Annual Report Download - page 130
Download and view the complete annual report
Please find page 130 of the 2015 Xerox annual report below. You can navigate through the pages in the report by either clicking on the pages listed below, or by using the keyword search tool below to find specific information within the annual report.-
 1
1 -
2
-
3
-
4
-
5
-
6
-
7
-
8
-
9
-
10
-
11
-
12
-
13
-
14
-
15
-
16
-
17
-
18
-
19
-
20
-
21
-
22
-
23
-
24
-
25
-
26
-
27
-
28
-
29
-
30
-
31
-
32
-
33
-
34
-
35
-
36
-
37
-
38
-
39
-
40
-
41
-
42
-
43
-
44
-
45
-
46
-
47
-
48
-
49
-
50
-
51
-
52
-
53
-
54
-
55
-
56
-
57
-
58
-
59
-
60
-
61
-
62
-
63
-
64
-
65
-
66
-
67
-
68
-
69
-
70
-
71
-
72
-
73
-
74
-
75
-
76
-
77
-
78
-
79
-
80
-
81
-
82
-
83
-
84
-
85
-
86
-
87
-
88
-
89
-
90
-
91
-
92
-
93
-
94
-
95
-
96
-
97
-
98
-
99
-
100
-
101
-
102
-
103
-
104
-
105
-
106
-
107
-
108
-
109
-
110
-
111
-
112
-
113
-
114
-
115
-
116
-
117
-
118
-
119
-
 120
120 -
 121
121 -
 122
122 -
 123
123 -
 124
124 -
 125
125 -
 126
126 -
 127
127 -
 128
128 -
 129
129 -
 130
130 -
 131
131 -
 132
132 -
 133
133 -
 134
134 -
 135
135 -
 136
136 -
 137
137 -
 138
138 -
 139
139 -
 140
140 -
141
-
142
-
143
-
144
-
145
-
146
-
147
-
148
-
149
-
150
-
151
-
152
-
153
-
154
-
155
-
156
-
157
-
158
 |
 |

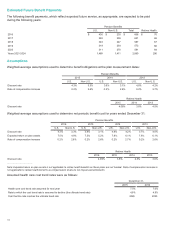
Estimated Future Benefit Payments
The following benefit payments, which reflect expected future service, as appropriate, are expected to be paid
during the following years:
Pension Benefits
U.S. Non-U.S. Total Retiree Health
2016 $ 436 $230 $666 $70
2017 392 239 631 68
2018 340 247 587 67
2019 319 254 573 66
2020 311 270 581 64
Years 2021-2024 1,469 1,411 2,880 296
Assumptions
Weighted-average assumptions used to determine benefit obligations at the plan measurement dates:
Pension Benefits
2015 2014 2013
U.S. Non-U.S. U.S. Non-U.S. U.S. Non-U.S.
Discount rate 4.3% 3.3% 3.9% 3.1% 4.8% 4.2%
Rate of compensation increase 0.2% 2.6% 0.2% 2.6% 0.2% 2.7%
Retiree Health
2015 2014 2013
Discount rate 4.09%3.8%4.5%
Weighted-average assumptions used to determine net periodic benefit cost for years ended December 31:
Pension Benefits
2016 2015 2014 2013
U.S. Non-U.S. U.S. Non-U.S. U.S. Non-U.S. U.S. Non-U.S.
Discount rate 4.3% 3.3% 3.9% 3.1% 4.8% 4.2% 3.7% 4.0%
Expected return on plan assets 7.5% 4.9% 7.5% 5.2% 7.8% 6.1% 7.8% 6.1%
Rate of compensation increase 0.2% 2.6% 0.2% 2.6% 0.2% 2.7% 0.2% 2.6%
Retiree Health
2016 2015 2014 2013
Discount rate 4.09% 3.8% 4.5% 3.6%
_____________________________
Note: Expected return on plan assets is not applicable to retiree health benefits as these plans are not funded. Rate of compensation increase is
not applicable to retiree health benefits as compensation levels do not impact earned benefits.
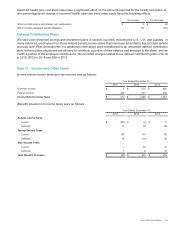
Assumed health care cost trend rates were as follows:
December 31,
2015 2014
Health care cost trend rate assumed for next year 7.5% 7.0%
Rate to which the cost trend rate is assumed to decline (the ultimate trend rate) 4.9% 4.9%
Year that the rate reaches the ultimate trend rate 2026 2023
113