Xerox 2015 Annual Report Download - page 77
Download and view the complete annual report
Please find page 77 of the 2015 Xerox annual report below. You can navigate through the pages in the report by either clicking on the pages listed below, or by using the keyword search tool below to find specific information within the annual report.-
 1
1 -
2
-
3
-
4
-
5
-
6
-
7
-
8
-
9
-
10
-
11
-
12
-
13
-
14
-
15
-
16
-
17
-
18
-
19
-
20
-
21
-
22
-
23
-
24
-
25
-
26
-
27
-
28
-
29
-
30
-
31
-
32
-
33
-
34
-
35
-
36
-
37
-
38
-
39
-
40
-
41
-
42
-
43
-
44
-
45
-
46
-
47
-
48
-
49
-
50
-
51
-
52
-
53
-
54
-
55
-
56
-
57
-
58
-
59
-
60
-
61
-
62
-
63
-
64
-
65
-
66
-
 67
67 -
 68
68 -
 69
69 -
 70
70 -
 71
71 -
 72
72 -
 73
73 -
 74
74 -
 75
75 -
 76
76 -
 77
77 -
 78
78 -
 79
79 -
 80
80 -
 81
81 -
 82
82 -
 83
83 -
 84
84 -
 85
85 -
 86
86 -
 87
87 -
88
-
89
-
90
-
91
-
92
-
93
-
94
-
95
-
96
-
97
-
98
-
99
-
100
-
101
-
102
-
103
-
104
-
105
-
106
-
107
-
108
-
109
-
110
-
111
-
112
-
113
-
114
-
115
-
116
-
117
-
118
-
119
-
120
-
121
-
122
-
123
-
124
-
125
-
126
-
127
-
128
-
129
-
130
-
131
-
132
-
133
-
134
-
135
-
136
-
137
-
138
-
139
-
140
-
141
-
142
-
143
-
144
-
145
-
146
-
147
-
148
-
149
-
150
-
151
-
152
-
153
-
154
-
155
-
156
-
157
-
158
 |
 |

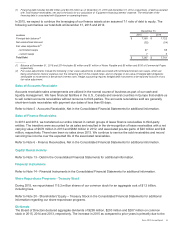
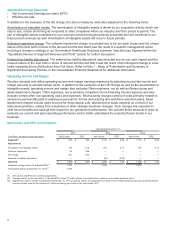
Effective Tax reconciliation:
Year Ended December 31, 2015 Year Ended December 31, 2014 Year Ended December 31, 2013
(in millions)
Pre-Tax
Income
Income Tax
(Benefit)
Expense
Effective
Tax Rate
Pre-Tax
Income
Income Tax
Expense
Effective
Tax Rate
Pre-Tax
Income
Income Tax
Expense
Effective
Tax Rate
Reported(1) $ 412 $ (23) (5.6)% $ 1,206 $ 215 17.8% $ 1,243 $ 253 20.4%
Adjustments:
Amortization of intangible assets 310 117 315 119 305 116
Software Impairment 146 56 — — — —
HE Charge 389 148 — — — —
Deferred tax liability adjustment —— —44 ——
Adjusted $ 1,257 $ 298 23.7 % $ 1,521 $ 378 24.9% $ 1,548 $ 369 23.8%
__________
(1) Pre-tax income and income tax (benefit) expense from continuing operations.
Operating Income / Margin reconciliation:
Year Ended December 31, 2015 Year Ended December 31, 2014 Year Ended December 31, 2013
(in millions) Profit Revenue Margin Profit Revenue Margin Profit Revenue Margin
Reported Pre-tax Income(1) $ 412 $ 18,045 2.3% $ 1,206 $ 19,540 6.2% $ 1,243 $ 20,006 6.2%
Adjustments:
Amortization of intangible assets 310 315 305
Restructuring and asset impairment
charges 186 128 115
HE Charge 389 116 — — — —
Other expenses, net 233 232 146
Adjusted Operating Income / Margin $ 1,530 $ 18,161 8.4% $ 1,881 $ 19,540 9.6% $ 1,809 $ 20,006 9.0%
____________
(1) Profit and revenue from continuing operations.
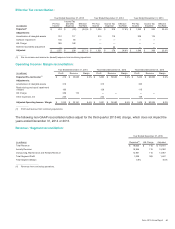
The following non-GAAP reconciliation tables adjust for the third quarter 2015 HE charge, which does not impact the
years ended December 31, 2014 or 2013.
Revenue / Segment reconciliation:
Year Ended December 31, 2015
(in millions) Reported(1) HE Charge Adjusted
Total Revenue $ 18,045 $ 116 $ 18,161
Annuity Revenue 15,264 116 15,380
Outsourcing, Maintenance and Rentals Revenue 12,951 116 13,067
Total Segment Profit 1,058 389 1,447
Total Segment Margin 5.9% 8.0%
__________________________
(1) Revenue from continuing operations.
Xerox 2015 Annual Report 60