Xerox 2015 Annual Report Download - page 105
Download and view the complete annual report
Please find page 105 of the 2015 Xerox annual report below. You can navigate through the pages in the report by either clicking on the pages listed below, or by using the keyword search tool below to find specific information within the annual report.-
 1
1 -
2
-
3
-
4
-
5
-
6
-
7
-
8
-
9
-
10
-
11
-
12
-
13
-
14
-
15
-
16
-
17
-
18
-
19
-
20
-
21
-
22
-
23
-
24
-
25
-
26
-
27
-
28
-
29
-
30
-
31
-
32
-
33
-
34
-
35
-
36
-
37
-
38
-
39
-
40
-
41
-
42
-
43
-
44
-
45
-
46
-
47
-
48
-
49
-
50
-
51
-
52
-
53
-
54
-
55
-
56
-
57
-
58
-
59
-
60
-
61
-
62
-
63
-
64
-
65
-
66
-
67
-
68
-
69
-
70
-
71
-
72
-
73
-
74
-
75
-
76
-
77
-
78
-
79
-
80
-
81
-
82
-
83
-
84
-
85
-
86
-
87
-
88
-
89
-
90
-
91
-
92
-
93
-
94
-
 95
95 -
 96
96 -
 97
97 -
 98
98 -
 99
99 -
 100
100 -
 101
101 -
 102
102 -
 103
103 -
 104
104 -
 105
105 -
 106
106 -
 107
107 -
 108
108 -
 109
109 -
 110
110 -
 111
111 -
 112
112 -
 113
113 -
 114
114 -
 115
115 -
116
-
117
-
118
-
119
-
120
-
121
-
122
-
123
-
124
-
125
-
126
-
127
-
128
-
129
-
130
-
131
-
132
-
133
-
134
-
135
-
136
-
137
-
138
-
139
-
140
-
141
-
142
-
143
-
144
-
145
-
146
-
147
-
148
-
149
-
150
-
151
-
152
-
153
-
154
-
155
-
156
-
157
-
158
 |
 |

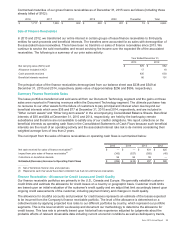
Contractual maturities of our gross finance receivables as of December 31, 2015 were as follows (including those
already billed of $102):
2016 2017 2018 2019 2020 Thereafter Total
$ 1,717 $ 1,295 $ 922 $ 530 $201 $18$
4,683
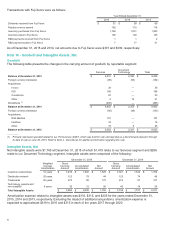
Sale of Finance Receivables
In 2013 and 2012, we transferred our entire interest in certain groups of lease finance receivables to third-party
entities for cash proceeds and beneficial interests. The transfers were accounted for as sales with derecognition of
the associated lease receivables. There have been no transfers or sales of finance receivables since 2013. We
continue to service the sold receivables and record servicing fee income over the expected life of the associated
receivables. The following is a summary of our prior sales activity:
Year Ended December 31,
2013 2012
Net carrying value (NCV) sold $ 676 $682
Allowance included in NCV 17 18
Cash proceeds received 635 630
Beneficial interests received 86 101
The principal value of the finance receivables derecognized from our balance sheet was $238 and $549 at
December 31, 2015 and 2014, respectively (sales value of approximately $256 and $596, respectively).
Summary Finance Receivable Sales
The lease portfolios transferred and sold were all from our Document Technology segment and the gains on these
sales were reported in Financing revenues within the Document Technology segment. The ultimate purchaser has
no recourse to our other assets for the failure of customers to pay principal and interest when due beyond our
beneficial interests which were $38 and $77 at December 31, 2015 and 2014, respectively, and are included in
"Other current assets" and "Other long-term assets" in the accompanying Consolidated Balance Sheets. Beneficial
interests of $30 and $64 at December 31, 2015 and 2014, respectively, are held by the bankruptcy-remote
subsidiaries and therefore are not available to satisfy any of our creditor obligations. We report collections on the
beneficial interests as operating cash flows in the Consolidated Statements of Cash Flows because such beneficial
interests are the result of an operating activity and the associated interest rate risk is de minimis considering their
weighted average lives of less than 2 years.
The net impact from the sales of finance receivables on operating cash flows is summarized below:
2015 2014 2013 2012
Net cash received for sales of finance receivables(1) $—$—$
631 $625
Impact from prior sales of finance receivables(2) (342)(527)(392)(45)
Collections on beneficial interests 56 94 58 —
Estimated (Decrease) Increase to Operating Cash Flows $(286)$ (433)$ 297 $580
____________
(1) Net of beneficial interest, fees and expenses.
(2) Represents cash that would have been collected if we had not sold finance receivables.
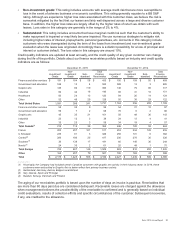
Finance Receivables - Allowance for Credit Losses and Credit Quality
Our finance receivable portfolios are primarily in the U.S., Canada and Europe. We generally establish customer
credit limits and estimate the allowance for credit losses on a country or geographic basis. Customer credit limits
are based upon an initial evaluation of the customer's credit quality and we adjust that limit accordingly based upon
ongoing credit assessments of the customer, including payment history and changes in credit quality.
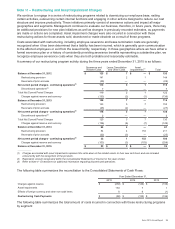
The allowance for doubtful accounts and provision for credit losses represents an estimate of the losses expected
to be incurred from the Company's finance receivable portfolio. The level of the allowance is determined on a
collective basis by applying projected loss rates to our different portfolios by country, which represent our portfolio
segments. This is the level at which we develop and document our methodology to determine the allowance for
credit losses. This loss rate is primarily based upon historical loss experience adjusted for judgments about the
probable effects of relevant observable data including current economic conditions as well as delinquency trends,
Xerox 2015 Annual Report 88