Xerox 2015 Annual Report Download - page 128
Download and view the complete annual report
Please find page 128 of the 2015 Xerox annual report below. You can navigate through the pages in the report by either clicking on the pages listed below, or by using the keyword search tool below to find specific information within the annual report.-
 1
1 -
2
-
3
-
4
-
5
-
6
-
7
-
8
-
9
-
10
-
11
-
12
-
13
-
14
-
15
-
16
-
17
-
18
-
19
-
20
-
21
-
22
-
23
-
24
-
25
-
26
-
27
-
28
-
29
-
30
-
31
-
32
-
33
-
34
-
35
-
36
-
37
-
38
-
39
-
40
-
41
-
42
-
43
-
44
-
45
-
46
-
47
-
48
-
49
-
50
-
51
-
52
-
53
-
54
-
55
-
56
-
57
-
58
-
59
-
60
-
61
-
62
-
63
-
64
-
65
-
66
-
67
-
68
-
69
-
70
-
71
-
72
-
73
-
74
-
75
-
76
-
77
-
78
-
79
-
80
-
81
-
82
-
83
-
84
-
85
-
86
-
87
-
88
-
89
-
90
-
91
-
92
-
93
-
94
-
95
-
96
-
97
-
98
-
99
-
100
-
101
-
102
-
103
-
104
-
105
-
106
-
107
-
108
-
109
-
110
-
111
-
112
-
113
-
114
-
115
-
116
-
117
-
 118
118 -
 119
119 -
 120
120 -
 121
121 -
 122
122 -
 123
123 -
 124
124 -
 125
125 -
 126
126 -
 127
127 -
 128
128 -
 129
129 -
 130
130 -
 131
131 -
 132
132 -
 133
133 -
 134
134 -
 135
135 -
 136
136 -
 137
137 -
 138
138 -
139
-
140
-
141
-
142
-
143
-
144
-
145
-
146
-
147
-
148
-
149
-
150
-
151
-
152
-
153
-
154
-
155
-
156
-
157
-
158
 |
 |

December 31, 2014
U.S. Plans Non-U.S. Plans
Asset Class Level 1 Level 2 Level 3 Total % Level 1 Level 2 Level 3 Total %
Cash and cash equivalents $ 52 $ — $ — $ 52 2% $ 608 $ — $ — $ 608 10%
Equity Securities:
U.S. large cap 332 15 — 347 11% 253 52 — 305 5%
U.S. mid cap 73 — — 73 2% 10 — — 10 —%
U.S. small cap 52 39 — 91 3% 28 — — 28 —%
International developed 195 92 — 287 9% 1,065 162 — 1,227 20%
Emerging markets 140 113 — 253 8% 276 69 — 345 6%
Global Equity 2 7 — 9 —% 4 6 — 10 —%
Total Equity Securities 794 266 — 1,060 33% 1,636 289 — 1,925 31%
Fixed Income Securities:
U.S. treasury securities — 145 — 145 5% 7 26 — 33 1%
Debt security issued by
government agency — 225 — 225 7% 25 1,536 — 1,561 26%
Corporate bonds — 988 — 988 32% 23 850 — 873 15%
Asset backed securities — 10 — 10 —%—1—1—%
Total Fixed Income Securities — 1,368 — 1,368 44% 55 2,413 — 2,468 42%
Derivatives:
Interest rate contracts — (1) — (1) —% — 128 — 128 2%
Foreign exchange
contracts — 1 — 1 —% — (5) — (5) —%
Equity contracts —————%—————%
Other contracts —————%—14—14 —%
Total Derivatives —————%—137—1372%
Real estate 46 39 25 110 4% — 29 279 308 5%
Private equity/venture capital — — 497 497 16% — — 499 499 8%
Guaranteed insurance
contracts —————%——1291292%
Other(1) (1) 40 — 39 1% 6 8 — 14 —%
Total Fair Value of Plan
Assets $ 891 $ 1,713 $ 522 $ 3,126 100% $ 2,305 $ 2,876 $ 907 $ 6,088 100%
_____________________________
(1) Other Level 1 assets include net non-financial liabilities of $(1) U.S. and $6 Non-U.S., such as due to/from broker, interest receivables and
accrued expenses.
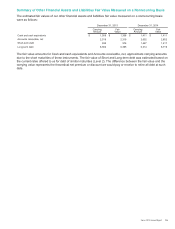
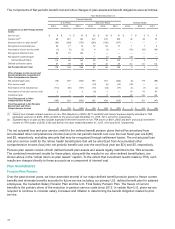
The following tables represents a roll-forward of the defined benefit plans assets measured using significant
unobservable inputs (Level 3 assets):
Fair Value Measurement Using Significant Unobservable Inputs (Level 3)
U.S. Defined Benefit Plans Assets Non-U.S. Defined Benefit Plans Assets
Real
Estate
Private
Equity/
Venture
Capital Total
Real
Estate
Private
Equity/
Venture
Capital
Guaranteed
Insurance
Contracts Total
Balance at December 31, 2013 $29 $451 $480 $269 $212 $135 $616
Purchases 1 44 45 74 279 22 375
Sales (6)(59)(65)(64)—(25)(89)
Realized (losses) gains (7) 41 34 20 — 15 35
Unrealized gains (losses) 8 20 28 (1) 38 — 37
Currency translation — — — (19)(30)(18)(67)
Balance at December 31, 2014 25 497 522 279 499 129 907
Purchases — 48 48 10 56 22 88
Sales (16) (67)(83)(7) — (21)(28)
Realized gains (losses) 1 52 53 (1) — 65
Unrealized gains (losses) 9 (31)(22)14 21 136
Currency translation — — — (15)(26)(13)(54)
Balance at December 31, 2015 $19 $499 $518 $280 $550 $124 $954
111