Xerox 2015 Annual Report Download - page 64
Download and view the complete annual report
Please find page 64 of the 2015 Xerox annual report below. You can navigate through the pages in the report by either clicking on the pages listed below, or by using the keyword search tool below to find specific information within the annual report.-
 1
1 -
2
-
3
-
4
-
5
-
6
-
7
-
8
-
9
-
10
-
11
-
12
-
13
-
14
-
15
-
16
-
17
-
18
-
19
-
20
-
21
-
22
-
23
-
24
-
25
-
26
-
27
-
28
-
29
-
30
-
31
-
32
-
33
-
34
-
35
-
36
-
37
-
38
-
39
-
40
-
41
-
42
-
43
-
44
-
45
-
46
-
47
-
48
-
49
-
50
-
51
-
52
-
53
-
 54
54 -
 55
55 -
 56
56 -
 57
57 -
 58
58 -
 59
59 -
 60
60 -
 61
61 -
 62
62 -
 63
63 -
 64
64 -
 65
65 -
 66
66 -
 67
67 -
 68
68 -
 69
69 -
 70
70 -
 71
71 -
 72
72 -
 73
73 -
 74
74 -
75
-
76
-
77
-
78
-
79
-
80
-
81
-
82
-
83
-
84
-
85
-
86
-
87
-
88
-
89
-
90
-
91
-
92
-
93
-
94
-
95
-
96
-
97
-
98
-
99
-
100
-
101
-
102
-
103
-
104
-
105
-
106
-
107
-
108
-
109
-
110
-
111
-
112
-
113
-
114
-
115
-
116
-
117
-
118
-
119
-
120
-
121
-
122
-
123
-
124
-
125
-
126
-
127
-
128
-
129
-
130
-
131
-
132
-
133
-
134
-
135
-
136
-
137
-
138
-
139
-
140
-
141
-
142
-
143
-
144
-
145
-
146
-
147
-
148
-
149
-
150
-
151
-
152
-
153
-
154
-
155
-
156
-
157
-
158
 |
 |

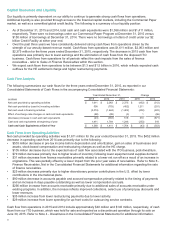
Pipeline
The sales pipeline includes the Total Contract Value (TCV) of new business opportunities that potentially could be
contracted within the next six months and excludes new business opportunities with estimated annual recurring
revenue in excess of $100 million. Our total Services sales pipeline at December 31, 2015 declined 15%
compared to 2014, reflecting increased TCV signings in 2015, including larger deals, and our second quarter 2015
strategic decision to narrow the focus in our Government Healthcare Solutions business.
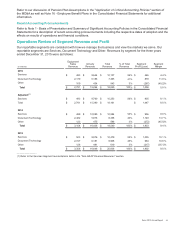
Revenue 2014
Services revenue of $10,584 million increased 1% with no impact from currency.
• BPO revenue increased 1% and represented 68% of total Services revenue. Growth from acquisitions along
with organic growth in commercial healthcare and litigation services as well as growth internationally were
partially offset by declines in portions of customer care. In addition, the anticipated declines in the student loan
business and the Texas Medicaid contract termination had a combined 2.6-percentage point negative impact
on BPO revenue growth and a 1.8-percentage point negative impact on total Services revenue.
In 2014, BPO revenue mix across the major business areas was as follows: Commercial - 45%;
Government and Transportation - 25%; Commercial Healthcare - 18%; and Government Healthcare -
12%.
• DO revenue increased 1% and represented 32% of total Services revenue. The increase in DO revenue was
primarily driven by growth in our partner print services offerings offset by declines in Europe and other markets
due to contract run-off and new contract ramp timing.
Segment Margin 2014
Services segment margin of 9.0% decreased 1.1-percentage points from the prior year primarily due primarily to a
1.1-percentage point decline in gross margin, as margin improvements in DO, commercial healthcare, human
resources and commercial European businesses were more than offset by decreased margin in government
healthcare and government and transportation. Productivity improvements and restructuring benefits were
insufficient to offset higher expenses associated with our government healthcare Medicaid and Health Insurance
Exchange (HIX) platforms, net non-cash impairment charges for the HIX platform, higher compensation expenses,
the anticipated run-off of the student loan business and price declines consistent with prior years. The gross
margin decline was partially offset by improvements in SAG reflecting restructuring benefits.
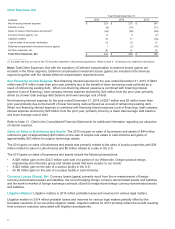
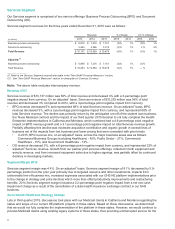
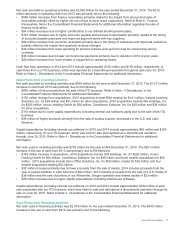
Document Technology Segment
Our Document Technology segment includes the sale of products and supplies, as well as the associated
maintenance and financing of those products.
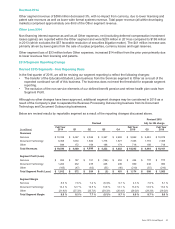
Document Technology segment revenues for the three years ended December 31, 2015 were as follows:
Revenue % Change CC % Change
(in millions) 2015 2014 2013 2015 2014 2015 2014
Equipment sales $ 2,179 $2,482 $2,727 (12)%(9)%(9)% (9)%
Annuity revenue 5,186 5,876 6,181 (12)%(5)%(8)% (5)%
Total Revenue $7,365 $8,358 $8,908 (12)%(6)%(8)% (6)%
Revenue 2015
Document Technology revenue of $7,365 million decreased 12%, with a 4-percentage point negative impact from
currency. Total revenues include the following:
• Equipment sales revenue decreased 12% with a 3-percentage point negative impact from currency. The
decline was across all product groups and was driven by weakness in developing markets, lower OEM sales,
lower sales of production products due to product launch timing, continued migration of customers to our
partner print services offering (included in our Services segment), and overall price declines that continue to be
within our historical range of 5% to 10%.
47