Xerox 2015 Annual Report Download - page 100
Download and view the complete annual report
Please find page 100 of the 2015 Xerox annual report below. You can navigate through the pages in the report by either clicking on the pages listed below, or by using the keyword search tool below to find specific information within the annual report.-
 1
1 -
2
-
3
-
4
-
5
-
6
-
7
-
8
-
9
-
10
-
11
-
12
-
13
-
14
-
15
-
16
-
17
-
18
-
19
-
20
-
21
-
22
-
23
-
24
-
25
-
26
-
27
-
28
-
29
-
30
-
31
-
32
-
33
-
34
-
35
-
36
-
37
-
38
-
39
-
40
-
41
-
42
-
43
-
44
-
45
-
46
-
47
-
48
-
49
-
50
-
51
-
52
-
53
-
54
-
55
-
56
-
57
-
58
-
59
-
60
-
61
-
62
-
63
-
64
-
65
-
66
-
67
-
68
-
69
-
70
-
71
-
72
-
73
-
74
-
75
-
76
-
77
-
78
-
79
-
80
-
81
-
82
-
83
-
84
-
85
-
86
-
87
-
88
-
89
-
 90
90 -
 91
91 -
 92
92 -
 93
93 -
 94
94 -
 95
95 -
 96
96 -
 97
97 -
 98
98 -
 99
99 -
 100
100 -
 101
101 -
 102
102 -
 103
103 -
 104
104 -
 105
105 -
 106
106 -
 107
107 -
 108
108 -
 109
109 -
 110
110 -
111
-
112
-
113
-
114
-
115
-
116
-
117
-
118
-
119
-
120
-
121
-
122
-
123
-
124
-
125
-
126
-
127
-
128
-
129
-
130
-
131
-
132
-
133
-
134
-
135
-
136
-
137
-
138
-
139
-
140
-
141
-
142
-
143
-
144
-
145
-
146
-
147
-
148
-
149
-
150
-
151
-
152
-
153
-
154
-
155
-
156
-
157
-
158
 |
 |

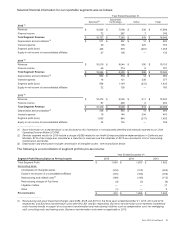
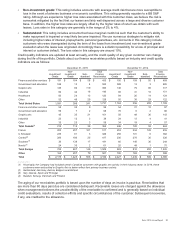
Geographic area data is based upon the location of the subsidiary reporting the revenue or long-lived assets and is
as follows for the three years ended December 31:
Revenues Long-Lived Assets
(1)
2015 2014 2013 2015 2014 2013
United States $ 12,557 $ 13,041 $13,272 $1,279 $1,758 $1,870
Europe 3,783 4,428 4,414 476 632 761
Other areas 1,705 2,071 2,320 234 240 243
Total Revenues and Long-Lived Assets $ 18,045 $ 19,540 $20,006 $1,989 $2,630 $2,874
________________
(1) Long-lived assets are comprised of (i) Land, buildings and equipment, net, (ii) Equipment on operating leases, net, (iii) Internal use
software, net and (iv) Product software, net.
Note 3 – Acquisitions
2015 Acquisitions
In September 2015 we acquired RSA Medical LLC (RSA Medical) for approximately $141 in cash. RSA Medical is
a leading provider of health assessment and risk management for members interacting with health and life
insurance companies. The acquisition of RSA Medical expands Xerox's portfolio of healthcare service offerings to
payers and life insurers using predictive analytics to enhance member outreach services aimed at improving overall
population health. RSA Medical is included in our Services segment. The purchase price adjustment for this
acquisition has not been finalized.
In January 2015 we acquired Intellinex LLC (Intellinex), formerly Intrepid Learning Solutions, Inc., a Seattle-based
company, for $28 in cash. Intellinex provides outsourced learning services primarily in the aerospace manufacturing
and technology industries. The acquisition of Intellinex solidifies the position of Xerox's Learning Services unit as a
leading provider of end-to-end outsourced learning services, and adds key vertical market expertise in the
aerospace industry. Intellinex is included in our Services segment.
Additionally, during 2015, our Services segment acquired two additional business for approximately $28 in cash,
and our Document Technology segment acquired two additional business for approximately $13 in cash.
2015 Summary
All of our 2015 acquisitions resulted in 100% ownership of the acquired companies. The operating results of the
acquisitions described above are not material to our financial statements and are included within our results from
their respective acquisition dates. Our 2015 acquisitions contributed aggregate revenues of approximately $43 to
our 2015 total revenues from their respective acquisition dates. The purchase prices for all acquisitions were
primarily allocated to intangible assets and goodwill based on third-party valuations and management's estimates.
The primary elements that generated the goodwill are the value of synergies and the acquired assembled
workforce. Approximately 63% of the goodwill recorded in 2015 is expected to be deductible for tax purposes. Refer
to Note 10 - Goodwill and Intangible Assets, Net for additional information.
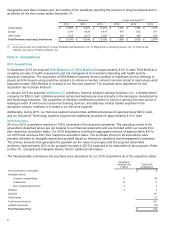
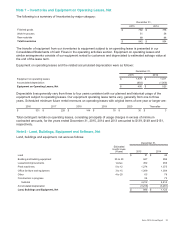
The following table summarizes the purchase price allocations for our 2015 acquisitions as of the acquisition dates:
Weighted-
Average Life
(Years)
Total 2015
Acquisitions
Accounts/finance receivables $8
Intangible assets:
Customer relationships 949
Trademarks 12 2
Non-compete agreements 42
Software 4 7
Goodwill 151
Other assets 12
Total Assets Acquired 231
Liabilities assumed (21)
Total Purchase Price $210
83