Xerox 2015 Annual Report Download - page 63
Download and view the complete annual report
Please find page 63 of the 2015 Xerox annual report below. You can navigate through the pages in the report by either clicking on the pages listed below, or by using the keyword search tool below to find specific information within the annual report.-
 1
1 -
2
-
3
-
4
-
5
-
6
-
7
-
8
-
9
-
10
-
11
-
12
-
13
-
14
-
15
-
16
-
17
-
18
-
19
-
20
-
21
-
22
-
23
-
24
-
25
-
26
-
27
-
28
-
29
-
30
-
31
-
32
-
33
-
34
-
35
-
36
-
37
-
38
-
39
-
40
-
41
-
42
-
43
-
44
-
45
-
46
-
47
-
48
-
49
-
50
-
51
-
52
-
 53
53 -
 54
54 -
 55
55 -
 56
56 -
 57
57 -
 58
58 -
 59
59 -
 60
60 -
 61
61 -
 62
62 -
 63
63 -
 64
64 -
 65
65 -
 66
66 -
 67
67 -
 68
68 -
 69
69 -
 70
70 -
 71
71 -
 72
72 -
 73
73 -
74
-
75
-
76
-
77
-
78
-
79
-
80
-
81
-
82
-
83
-
84
-
85
-
86
-
87
-
88
-
89
-
90
-
91
-
92
-
93
-
94
-
95
-
96
-
97
-
98
-
99
-
100
-
101
-
102
-
103
-
104
-
105
-
106
-
107
-
108
-
109
-
110
-
111
-
112
-
113
-
114
-
115
-
116
-
117
-
118
-
119
-
120
-
121
-
122
-
123
-
124
-
125
-
126
-
127
-
128
-
129
-
130
-
131
-
132
-
133
-
134
-
135
-
136
-
137
-
138
-
139
-
140
-
141
-
142
-
143
-
144
-
145
-
146
-
147
-
148
-
149
-
150
-
151
-
152
-
153
-
154
-
155
-
156
-
157
-
158
 |
 |

states’ healthcare providers and constituents.
As a result of the determination that we would not complete these platform implementations, we recorded a pre-tax
charge of $389 million ($241 million after-tax) reflecting write-offs and estimated settlement costs as well as other
impacts from this determination. The charge included $116 million for the write-off of contract receivables (primarily
non-current), $34 million related to the non-cash impairment of the Enterprise software and deferred contract set-
up and transition costs and $14 million for other related assets and liabilities. The remainder of the charge is
primarily related to settlement costs including payments to subcontractors and is expected to be cash outflows in
future quarters. Although our negotiations with Montana have been finalized, we continue to negotiate with
California on a final settlement. We believe we have recorded our best estimate of the required liability for a
settlement in California, however, this estimate is subject to change when negotiations are finalized.
The above noted developments followed the change in our GHS strategy announced in July 2015, regarding our
decision to focus our future HE implementations on current Medicaid customers and to discontinue investment in
and sales of the Xerox Integrated Eligibility System (IES). This change in strategy resulted in a pre-tax non-cash
software impairment charge of $146 million ($90 million after-tax) in second quarter 2015 associated with our
Enterprise and IES software platforms.
We remain committed to the implementation and ongoing operation of the Health Enterprise platform for our four
other state clients, including our largest state client, New York. In addition, GHS is a significant and important
business for the Company, and we are committed to the business over the longer-term. We have a diverse
portfolio of healthcare solutions and will focus on the more profitable market segments from which we derive over
two thirds of GHS's revenues. We will continue to assess and modify our GHS strategy as the marketplace and
business conditions evolve.
Metrics
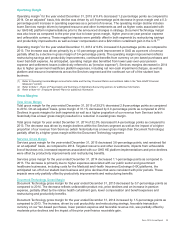
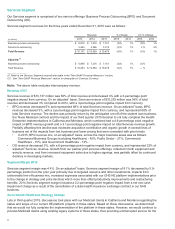
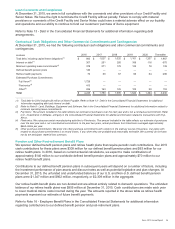
Signings
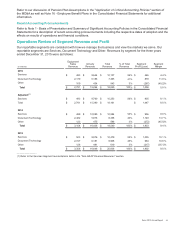
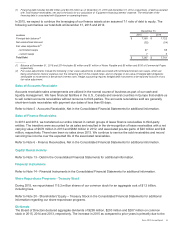
Signings are defined as estimated future revenues from contracts signed during the period, including renewals of
existing contracts. Signings were as follows:
Signings were as follows:
Year Ended December 31,
(in billions) 2015 2014 2013
BPO $ 8.4 $ 7.6 $ 8.9
DO 3.1 3.0 3.3
Total Signings $11.5 $10.6 $12.2
Services signings were an estimated $11.5 billion in Total Contract Value (TCV) for 2015 and increased 8% as
compared to the prior year. Signings in 2015 included large contracts such as the Florida Tolling and NY MMIS
contracts, which were partially offset by a modest decline in new business signings and a lower level of renewal
decision opportunities. New business annual recurring revenue (ARR) and non-recurring revenue (NRR)
decreased 1% compared to the prior year.
Services signings were an estimated $10.6 billion in TCV for 2014 and decreased 13% compared to the prior year.
The decrease was driven by a lower level of renewal decision opportunities and lower new business signings
which were partially impacted by customer decision delays and a decrease in the average contract length. New
business ARR and NRR decreased 13% compared to the prior year.
Note: The above DO signings amount represents Enterprise signings only and does not include signings from our
partner print services offerings, which is driving the revenue growth in DO. TCV is the estimated total contractual
revenue related to future contracts in the pipeline or signed contracts, as applicable.
Renewal Rate (Total Services)
Renewal rate is defined as the ARR on contracts that are renewed during the period as a percentage of ARR on all
contracts for which a renewal decision was made during the period. Our 2015 renewal rate of 84% was just below
our target range of 85%-90% but 3-percentage points higher than 2014.
Xerox 2015 Annual Report 46