Xerox 2015 Annual Report Download - page 56
Download and view the complete annual report
Please find page 56 of the 2015 Xerox annual report below. You can navigate through the pages in the report by either clicking on the pages listed below, or by using the keyword search tool below to find specific information within the annual report.-
 1
1 -
2
-
3
-
4
-
5
-
6
-
7
-
8
-
9
-
10
-
11
-
12
-
13
-
14
-
15
-
16
-
17
-
18
-
19
-
20
-
21
-
22
-
23
-
24
-
25
-
26
-
27
-
28
-
29
-
30
-
31
-
32
-
33
-
34
-
35
-
36
-
37
-
38
-
39
-
40
-
41
-
42
-
43
-
44
-
45
-
 46
46 -
 47
47 -
 48
48 -
 49
49 -
 50
50 -
 51
51 -
 52
52 -
 53
53 -
 54
54 -
 55
55 -
 56
56 -
 57
57 -
 58
58 -
 59
59 -
 60
60 -
 61
61 -
 62
62 -
 63
63 -
 64
64 -
 65
65 -
 66
66 -
67
-
68
-
69
-
70
-
71
-
72
-
73
-
74
-
75
-
76
-
77
-
78
-
79
-
80
-
81
-
82
-
83
-
84
-
85
-
86
-
87
-
88
-
89
-
90
-
91
-
92
-
93
-
94
-
95
-
96
-
97
-
98
-
99
-
100
-
101
-
102
-
103
-
104
-
105
-
106
-
107
-
108
-
109
-
110
-
111
-
112
-
113
-
114
-
115
-
116
-
117
-
118
-
119
-
120
-
121
-
122
-
123
-
124
-
125
-
126
-
127
-
128
-
129
-
130
-
131
-
132
-
133
-
134
-
135
-
136
-
137
-
138
-
139
-
140
-
141
-
142
-
143
-
144
-
145
-
146
-
147
-
148
-
149
-
150
-
151
-
152
-
153
-
154
-
155
-
156
-
157
-
158
 |
 |

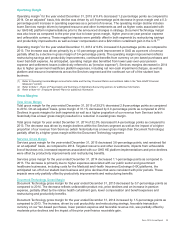
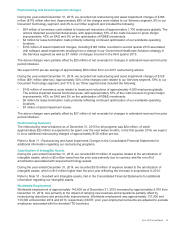
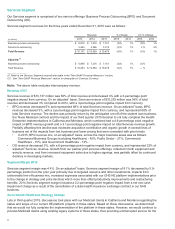
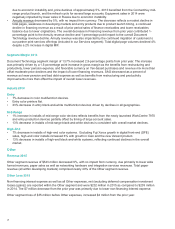
Research, Development and Engineering Expenses (RD&E)
Year Ended December 31, Change
(in millions) 2015 2014 2013 2015 2014
R&D $ 437 $ 445 $481 $(8)$
(36)
Sustaining engineering 126 132 122 (6) 10
Total RD&E Expenses $ 563 $ 577 $603 $(14)$ (26)
R&D Investment by Fuji Xerox(1) $ 569 $ 654 $724 $(85)$ (70)
______________
(1) Fluctuation in Fuji Xerox R&D was primarily due to changes in foreign exchange rates.
RD&E as a percent of revenue for the year ended December 31, 2015 of 3.1% increased 0.1-percentage points on
an actual and adjusted1 basis, as the total company revenue decline was only partially offset by modest RD&E
expense reductions and the benefits from the higher mix of Services revenue (which historically has a lower RD&E
as a percentage of revenue) and modest restructuring and productivity improvements.
RD&E of $563 million for the year ended December 31, 2015, was $14 million lower than 2014 reflecting the impact
of restructuring and productivity improvements.
Innovation is one of our core strengths and we continue to invest at levels to maintain and improve our
competitiveness, particularly in services, color and software. During 2015 we managed our investments in R&D to
align with growth opportunities in areas like business services, color printing and customized communication. Our
R&D is also strategically coordinated with Fuji Xerox.
RD&E as a percent of revenue for the year ended December 31, 2014 of 3.0% remained flat, reflecting the impact
of restructuring and productivity improvements and a higher mix of Services revenue (which historically has a lower
RD&E as a percentage of revenue), offset by increased investments in Services RD&E and the overall total
company revenue decline.
RD&E of $577 million for the year ended December 31, 2014, was $26 million lower than 2013 reflecting the impact
of restructuring and productivity improvements.
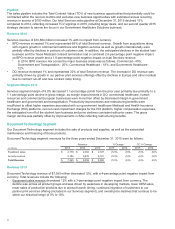
Selling, Administrative and General Expenses (SAG)
SAG as a percent of revenue of 19.7% increased 0.3-percentage points for the year ended December 31, 2015. On
an adjusted1 basis, SAG as a percentage of revenue of 19.6% increased 0.2-percentage points from 2014. The
increase was driven by a total company revenue decline only partially matched by expense reductions, as
restructuring and productivity improvements, lower compensation expense (including the favorable impact from the
curtailment gain), and a higher mix of Services revenue (which historically has lower SAG as a percentage of
revenue) were partly offset by Services investments.
SAG expenses of $3,559 million for the year ended December 31, 2015 were $229 million lower than the prior year
period. The decrease in SAG expense reflects the following:
• $137 million decrease in selling expenses.
• $92 million decrease in general and administrative expenses.
• Bad debt expense of $53 million was flat as compared to the prior year and less than one percent of
receivables.
SAG as a percent of revenue of 19.4% decreased 1.0-percentage point for the year ended December 31, 2014. The
decrease was driven by the higher mix of Services revenue (which historically has lower SAG as a percentage of
revenue), restructuring and productivity improvements, and lower pension and bad debt expense. The net reduction
in SAG spending exceeded the overall revenue decline on a percentage basis.
SAG expenses of $3,788 million for the year ended December 31, 2014 were $285 million lower than the prior year
period. The decrease in SAG expense reflects the following:
• $125 million decrease in selling expenses.
• $93 million decrease in general and administrative expenses.
• $67 million decrease in bad debt expense to $53 million, reflecting the favorable trend in write-offs and
recoveries experienced throughout the year. Full year 2014 bad debt expense remained less than one percent
of receivables.
39